Question Help According to a job website, each job opening on average attracted 251 résumés in 2016. The job market improved in 2017 compared to 2016, which means that more people will likely be switching jobs but alsc unemployed workers remain in the job market. To find out which trend is stronger, a random sample of 20 employers in a region was taken. Each employer reported how many résumés they received in 2017 for job opening. Their answers are shown in the accompanying table. Using a=0.10, complete parts a through d. E Click the icon to view the data on résumés received. a. State the null and altemative hypotheses. Job Opening Data Determine the null hypothesis, Ho, and the altermative hypothesis, H,. Ho: 251 %3D 210 208 * 251 219 251 (Type integers or decimals. Do not round.) 207 185 270 220 b. Does this sample provide enough evidence to suggest that the number of résumés that were received in 2017 has changed 283 225 Identify the critical value. 205 232 217 206 235 247
Question Help According to a job website, each job opening on average attracted 251 résumés in 2016. The job market improved in 2017 compared to 2016, which means that more people will likely be switching jobs but alsc unemployed workers remain in the job market. To find out which trend is stronger, a random sample of 20 employers in a region was taken. Each employer reported how many résumés they received in 2017 for job opening. Their answers are shown in the accompanying table. Using a=0.10, complete parts a through d. E Click the icon to view the data on résumés received. a. State the null and altemative hypotheses. Job Opening Data Determine the null hypothesis, Ho, and the altermative hypothesis, H,. Ho: 251 %3D 210 208 * 251 219 251 (Type integers or decimals. Do not round.) 207 185 270 220 b. Does this sample provide enough evidence to suggest that the number of résumés that were received in 2017 has changed 283 225 Identify the critical value. 205 232 217 206 235 247

Glencoe Algebra 1, Student Edition, 9780079039897, 0079039898, 2018
18th Edition
ISBN:9780079039897
Author:Carter
Publisher:Carter
Chapter10: Statistics
Section10.6: Summarizing Categorical Data
Problem 10CYU

Related questions
Question
Please help fast
Transcribed Image Text:Question Help ▼
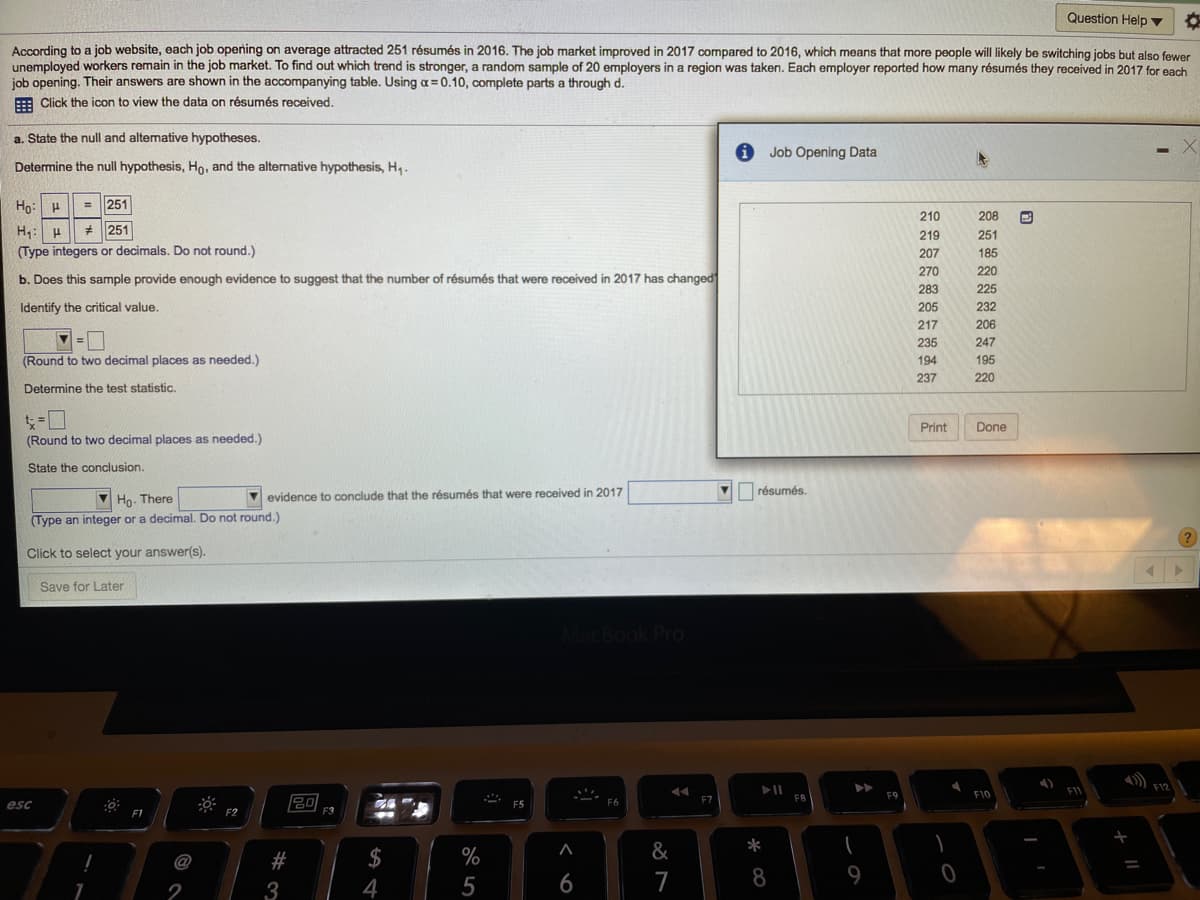
According to a job website, each job opening on average attracted 251 résumés in 2016. The job market improved in 2017 compared to 2016, which means that more people will likely be switching jobs but also fewer
unemploved workers remain in the job market. To find out which trend is stronger, a random sample of 20 employers in a region was taken. Each employer reported how many résumés they received in 2017 for each
job opening. Their answers are shown in the accompanying table. Using a= 0.10, complete parts a through d.
E Click the icon to view the data on résumés received.
a. State the null and altemative hypotheses.
Job Opening Data
Determine the null hypothesis, Ho, and the alternative hypothesis, H,.
Hn:
= 251
210
208
H: H
(Type integers or decimals. Do not round.)
* 251
219
251
207
185
270
220
b. Does this sample provide enough evidence to suggest that the number of résumés that were received in 2017 has changed
283
225
Identify the critical value.
205
232
217
206
235
247
(Round to two decimal places as needed.)
194
195
237
220
Determine the test statistic.
Print
Done
(Round to two decimal places as needed.)
State the conclusion.
résumés.
Ho. There
V evidence to conclude that the résumés that were received in 2017
(Type an integer or a decimal. Do not round.)
Click to select your answer(s).
Save for Later
MacBook Pro
F11
F9
F10
20
F7
FB
esc
F2
#
$
%
&
*
@
4
5
6
7
9
2
3
Transcribed Image Text:Question Help ▼
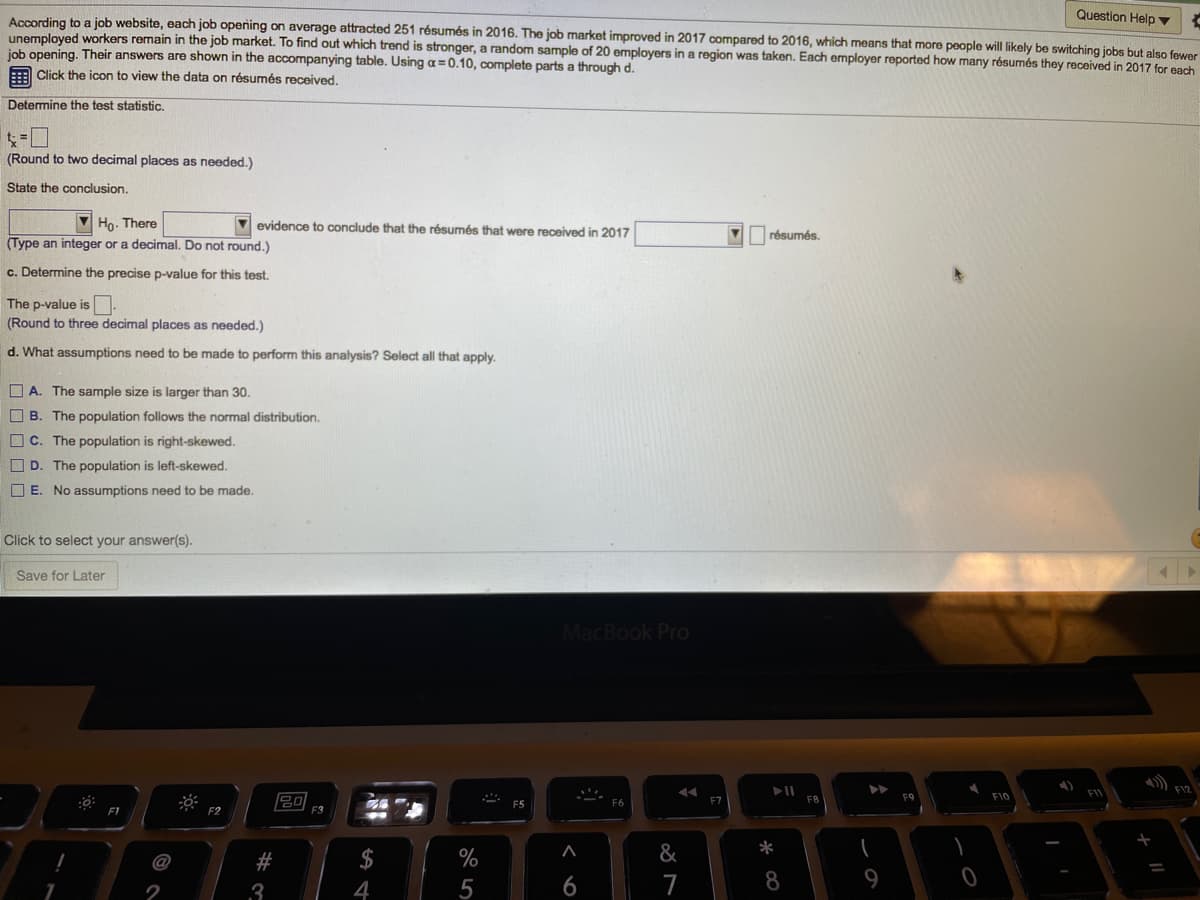
According to a job website, each job opening on average attracted 251 résumés in 2016. The job market improved in 2017 compared to 2016, which means that more people will likely be switching jobs but also fewer
unemployed workers remain in the job market. To find out which trend is stronger, a random sample of 20 employers in a region was taken. Each employer reported how many résumés they received in 2017 for each
job opening. Their answers are shown in the accompanying table. Using a=0.10, complete parts a through d.
:: Click the icon to view the data on résumés received.
Determine the test statistic.
(Round to two decimal places as needed.)
State the conclusion.
V Ho. There
(Type an integer or a decimal. Do not round.)
V evidence to conclude that the résumés that were received in 2017
V résumés.
c. Determine the precise p-value for this test.
The p-value is
(Round to three decimal places as needed.)
d. What assumptions need to be made to perform this analysis? Select all that apply.
O A. The sample size is larger than 30.
O B. The population follows the normal distribution.
O c. The population is right-skewed.
O D. The population is left-skewed.
O E. No assumptions need to be made.
Click to select your answer(s).
Save for Later
MacBook Pro
) F12
FIL
F9
F10
F6
F7
F1
F2
E3
#
$
%
&
*
3
4
6
7
8
2
Expert Solution
This question has been solved!
Explore an expertly crafted, step-by-step solution for a thorough understanding of key concepts.

Step by step
Solved in 5 steps

Knowledge Booster


Learn more about
Need a deep-dive on the concept behind this application? Look no further. Learn more about this topic, statistics and related others by exploring similar questions and additional content below.Recommended textbooks for you
Glencoe Algebra 1, Student Edition, 9780079039897…
Algebra
ISBN:
9780079039897
Author:
Carter
Publisher:
McGraw Hill


Holt Mcdougal Larson Pre-algebra: Student Edition…
Algebra
ISBN:
9780547587776
Author:
HOLT MCDOUGAL
Publisher:
HOLT MCDOUGAL
Glencoe Algebra 1, Student Edition, 9780079039897…
Algebra
ISBN:
9780079039897
Author:
Carter
Publisher:
McGraw Hill
Holt Mcdougal Larson Pre-algebra: Student Edition…
Algebra
ISBN:
9780547587776
Author:
HOLT MCDOUGAL
Publisher:
HOLT MCDOUGAL


College Algebra (MindTap Course List)
Algebra
ISBN:
9781305652231
Author:
R. David Gustafson, Jeff Hughes
Publisher:
Cengage Learning