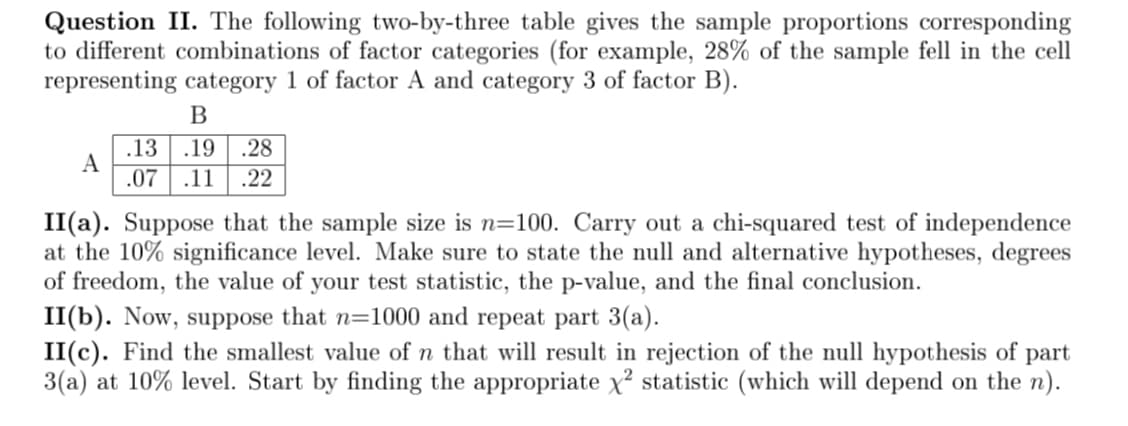
Question II. The following two-by-three table gives the sample proportions corresponding to different combinations of factor categories (for example, 28% of the sample fell in the cell representing category 1 of factor A and category 3 of factor B). A B .13 .19 .28 .07 .11 .22 II(a). Suppose that the sample size is n=100. Carry out a chi-squared test of independence at the 10% significance level. Make sure to state the null and alternative hypotheses, degrees of freedom, the value of your test statistic, the p-value, and the final conclusion. II(b). Now, suppose that n=1000 and repeat part 3(a). II(c). Find the smallest value of n that will result in rejection of the null hypothesis of part 3(a) at 10% level. Start by finding the appropriate x² statistic (which will depend on the n).
Question II. The following two-by-three table gives the sample proportions corresponding to different combinations of factor categories (for example, 28% of the sample fell in the cell representing category 1 of factor A and category 3 of factor B). A B .13 .19 .28 .07 .11 .22 II(a). Suppose that the sample size is n=100. Carry out a chi-squared test of independence at the 10% significance level. Make sure to state the null and alternative hypotheses, degrees of freedom, the value of your test statistic, the p-value, and the final conclusion. II(b). Now, suppose that n=1000 and repeat part 3(a). II(c). Find the smallest value of n that will result in rejection of the null hypothesis of part 3(a) at 10% level. Start by finding the appropriate x² statistic (which will depend on the n).

MATLAB: An Introduction with Applications
6th Edition
ISBN:9781119256830
Author:Amos Gilat
Publisher:Amos Gilat
Chapter1: Starting With Matlab
Section: Chapter Questions
Problem 1P

Related questions
Question
Transcribed Image Text:Question II. The following two-by-three table gives the sample proportions corresponding
to different combinations of factor categories (for example, 28% of the sample fell in the cell
representing category 1 of factor A and category 3 of factor B).
A
B
.13 .19 .28
.07 .11 .22
II(a). Suppose that the sample size is n=100. Carry out a chi-squared test of independence
at the 10% significance level. Make sure to state the null and alternative hypotheses, degrees
of freedom, the value of your test statistic, the p-value, and the final conclusion.
II(b). Now, suppose that n=1000 and repeat part 3(a).
II(c). Find the smallest value of n that will result in rejection of the null hypothesis of part
3(a) at 10% level. Start by finding the appropriate x² statistic (which will depend on the n).
Expert Solution
This question has been solved!
Explore an expertly crafted, step-by-step solution for a thorough understanding of key concepts.

Step by step
Solved in 3 steps with 3 images

Recommended textbooks for you
MATLAB: An Introduction with Applications
Statistics
ISBN:
9781119256830
Author:
Amos Gilat
Publisher:
John Wiley & Sons Inc

Probability and Statistics for Engineering and th…
Statistics
ISBN:
9781305251809
Author:
Jay L. Devore
Publisher:
Cengage Learning

Statistics for The Behavioral Sciences (MindTap C…
Statistics
ISBN:
9781305504912
Author:
Frederick J Gravetter, Larry B. Wallnau
Publisher:
Cengage Learning
MATLAB: An Introduction with Applications
Statistics
ISBN:
9781119256830
Author:
Amos Gilat
Publisher:
John Wiley & Sons Inc
Probability and Statistics for Engineering and th…
Statistics
ISBN:
9781305251809
Author:
Jay L. Devore
Publisher:
Cengage Learning
Statistics for The Behavioral Sciences (MindTap C…
Statistics
ISBN:
9781305504912
Author:
Frederick J Gravetter, Larry B. Wallnau
Publisher:
Cengage Learning

Elementary Statistics: Picturing the World (7th E…
Statistics
ISBN:
9780134683416
Author:
Ron Larson, Betsy Farber
Publisher:
PEARSON

The Basic Practice of Statistics
Statistics
ISBN:
9781319042578
Author:
David S. Moore, William I. Notz, Michael A. Fligner
Publisher:
W. H. Freeman

Introduction to the Practice of Statistics
Statistics
ISBN:
9781319013387
Author:
David S. Moore, George P. McCabe, Bruce A. Craig
Publisher:
W. H. Freeman