Question: What is the equation of the linear regression?

MATLAB: An Introduction with Applications
6th Edition
ISBN:9781119256830
Author:Amos Gilat
Publisher:Amos Gilat
Chapter1: Starting With Matlab
Section: Chapter Questions
Problem 1P

Related questions
Question
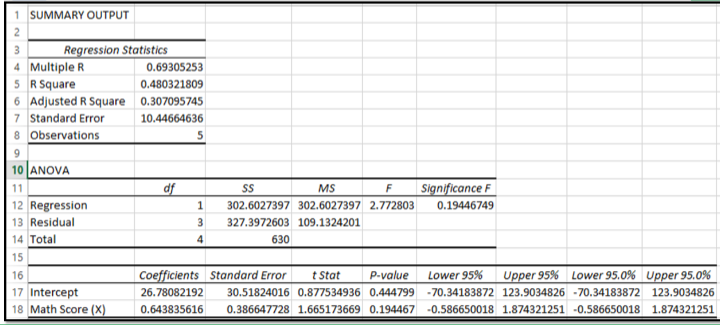
Transcribed Image Text:1 SUMMARY OUTPUT
2
Regression Statistics
3
4 Multiple R
5 R Square
6 Adjusted R Square
7 Standard Error
8 Observations
9
10 ANOVA
11
12 Regression
13 Residual
14 Total
15
16
17 Intercept
18 Math Score (X)
0.69305253
0.480321809
0.307095745
10.44664636
df
5
SS
MS
F
1 302.6027397 302.6027397 2.772803
3
327.3972603 109.1324201
4
630
Significance F
0.19446749
Coefficients Standard Error t Stat P-value Lower 95% Upper 95% Lower 95.0% Upper 95.0%
26.78082192 30.51824016 0.877534936 0.444799 -70.34183872 123.9034826 -70.34183872 123.9034826
0.643835616 0.386647728 1.665173669 0.194467 -0.586650018 1.874321251 -0.586650018 1.874321251
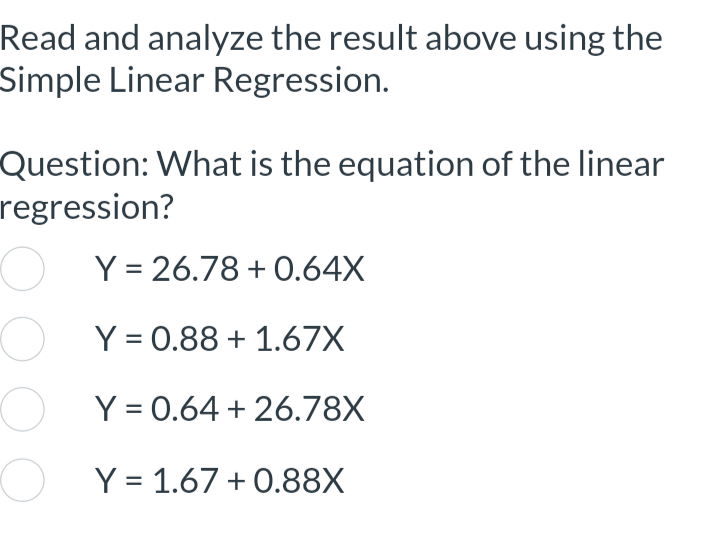
Transcribed Image Text:Read and analyze the result above using the
Simple Linear Regression.
Question: What is the equation of the linear
regression?
OY=26.78 +0.64X
OY=0.88 +1.67X
Y = 0.64 +26.78X
O Y = 1.67 +0.88X
Expert Solution
This question has been solved!
Explore an expertly crafted, step-by-step solution for a thorough understanding of key concepts.

Step by step
Solved in 2 steps

Recommended textbooks for you
MATLAB: An Introduction with Applications
Statistics
ISBN:
9781119256830
Author:
Amos Gilat
Publisher:
John Wiley & Sons Inc

Probability and Statistics for Engineering and th…
Statistics
ISBN:
9781305251809
Author:
Jay L. Devore
Publisher:
Cengage Learning

Statistics for The Behavioral Sciences (MindTap C…
Statistics
ISBN:
9781305504912
Author:
Frederick J Gravetter, Larry B. Wallnau
Publisher:
Cengage Learning
MATLAB: An Introduction with Applications
Statistics
ISBN:
9781119256830
Author:
Amos Gilat
Publisher:
John Wiley & Sons Inc
Probability and Statistics for Engineering and th…
Statistics
ISBN:
9781305251809
Author:
Jay L. Devore
Publisher:
Cengage Learning
Statistics for The Behavioral Sciences (MindTap C…
Statistics
ISBN:
9781305504912
Author:
Frederick J Gravetter, Larry B. Wallnau
Publisher:
Cengage Learning

Elementary Statistics: Picturing the World (7th E…
Statistics
ISBN:
9780134683416
Author:
Ron Larson, Betsy Farber
Publisher:
PEARSON

The Basic Practice of Statistics
Statistics
ISBN:
9781319042578
Author:
David S. Moore, William I. Notz, Michael A. Fligner
Publisher:
W. H. Freeman

Introduction to the Practice of Statistics
Statistics
ISBN:
9781319013387
Author:
David S. Moore, George P. McCabe, Bruce A. Craig
Publisher:
W. H. Freeman