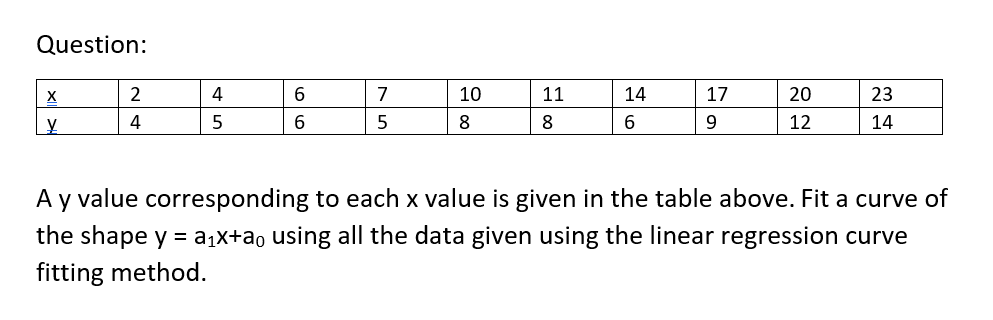
Question: X 2 4 6 7 10 11 14 17 20 23 y 4 5 6 5 8 8 6 9 12 14 A y value corresponding to each x value is given in the table above. Fit a curve of the shape y = a₁x+a using all the data given using the linear regression curve fitting method.


Q: uppose that the lifetime X (in hours) of a certain type of flashlight battery is a random variable…
A: Given Suppose that the lifetime X (in hours) of a certain type of flashlight battery is a random…
Q: Scenario: A guidance counselor wanted to know if anxiety differs based on time (first day of class…
A: In such case null hypothesis is, H0: The main effect of sports is not statistically significant.…
Q: Find the value for r, then interchange the values for x and y and find the value of r. Round your…
A: Given: x y 2 6 3 8 4 10 5 12 6 14
Q: A study was done to know if there is a relationship between obesity and atherosclerosis. A total of…
A: Given The total participants in the study =775The participants with atherosclerosis =312 Among these…
Q: An engineer would like to design a parking garage in the most cost-effective manner. He reads that…
A: Given information Hypothesized mean µ = 76.4 inches Sample size (n) = 100 Mean x̅ = 77.1 inches…
Q: The joint cdf of a random variable X and Y is given by Fxy(x, y) = -e¯ª)(l-e-by) _x≥0, y ≥0, a, b>0…
A:
Q: For the given data set: X 812 y 10 7 Part 1 of 6 2 15 11 5 | ! |; 6 13 19 2
A: Given : A dats set x y 8 10 12 7 2 15 11 6 5 13 19 2
Q: R Code
A: First write the R-code as below: ##First define the pdf given in the questionpdf <- function(x){…
Q: Consider the continuous random variable x with probability density function 15x²e-5xx3 for x ≥ 0…
A: For the above problem, the required R-code is given as below: ##First define the pdf given in the…
Q: a. b. Let X have a gamma distribution with a=2 and 3-2. What is P(X>2)? Let X have a log-normal…
A:
Q: Assume that all bonds in a portfolio can be assigned to three credit ratings: an AAA grade, a BBB…
A: Given:-
Q: A relatively elderly county, whose majority of registered voters are Democrats, with a mean…
A:
Q: In a study of 779 randomly selected medical malpractice lawsuits, it was found that 470 of them were…
A:
Q: An online food delivery service in metro manila claims that the delivery time is not greater than 30…
A: Given : Population SD (σ) = 3 Sample size (n) = 31 Sample mean (X¯) = 40 Level of significance (α)…
Q: The time taken to boil a kettle is normally distributed with a mean of 94 seconds and a standard…
A: The provided information is µ=94 σ=6 P(-a<X<a)=0.40…
Q: cenario and the analysis. It run the appropriate analyses thro OVI and report your findings in APA…
A: Research as a scientific and systematic approach for pertinent information on a specific domain…
Q: The data below are from an independent-measures experiment comparing three different treatment…
A: Given Information: No. of treatments=03No. of observations(N)=12
Q: b) Two resistors R1 and R2 are combined in series. Assume that the best estimate of R1 is 100 + 2 №.…
A: First we will calculate, Mean for R2 Standard deviation for R2 Than we have to answer for mentioned…
Q: Scenario: A sports psychologist studied the effect of a motivational program on number of injuries…
A:
Q: 4. Given the values below, predict the grade of a student in Math if his grade in English is 85…
A:
Q: Fill in the missing entries in the ANOVA table. e) What proportion of the total variability of the…
A: Anova used to explain the variation within and between various groups. It use F test to make…
Q: The data represent the 2011 salaries of basketball coaches of the following universities, entered in…
A: The formula for Range is, Range= Maximum value- Minimum Value The formula for Variance is,…
Q: 9. Given that (A) = (B) = (C) = ¹⁄N and 80 percent of A’s are B’s, 75 percent of the A’s are C's,…
A:
Q: The data below are from an independent-measures experiment comparing three different treatment…
A: Group 1 Group 2 Group 3 0 1 4 0 4 3 0 1 6 2 0 3 Sum = 2 6 16…
Q: Which is the final answer?
A:
Q: If I attend 3 more tutorials, what impact do I expect this to have on my final mark? The R2 value…
A: Please find the solution below. Thank you
Q: 68% of statistics Mean 95% of statistics 99.7% of statistics A Mean A Mean 1 st. 3 st dev 2 st. dev…
A: "Since you have posted a question with multiple sub-parts, we'll solve the first three sub-parts for…
Q: The probability of the joint event {x, < X ≤ x₂,₁ <Y ≤y₂} is given by P{x <X<x,,y<Y<y,} = Fxy(x,…
A:
Q: Effects of drug and alcohol on the nervous system have been the subject of significant research. A…
A: The provided information is x¯=1.05s=0.5n=100α=0.05 The degrees of freedom is df=n-1=100-1=99…
Q: Q.: For the data given in the following frequency distribution table, compute if the nearest error…
A: As per our guidelines we can solve first three sub part of question and rest can be reposted.…
Q: Fifty-four wild bears were anesthetized, and then their weights and chest sizes were measured and…
A: Note : As per guidelines we are supposed to solve only first three sub parts. Kindly repost the…
Q: Scenario: A sports psychologist studied the effect of a motivational program on number of injuries…
A: In such case null hypothesis is, H0: The main effect of sports is not statistically significant.…
Q: An number cube (a fair die) is rolled 3 times. For each roll, we are interested in whether the roll…
A: We can clearly see from the above table that X takes two values 1 and -3 . Therefore when the value…
Q: What type of sampling is described in this study? What is the appropriate inference procedure?…
A: Here the shoe company wants to determine if the new tread on its top line of running shoes lasts…
Q: Suppose that 20 friends get together to go bowling. Also, suppose that each person’s score is 15…
A: *Answer:
Q: the number of road construction projects that take place at any one time in a certain city follows a…
A: P.M.F. of poisson distribution is given by P(X=x)=e-m mxx! ;…
Q: The amount of coffee that people drink per day is normally distributed with a mean of 17 ounces and…
A:
Q: Choose which of the following is true when the optimal solution in a maximization problem in simplex…
A: "Since you have asked multiple questions, we will solve the first question for you. If you want any…
Q: (a) mean Round your answer to two decimal places (e.g. 98.76). (b) variance Round your answer to…
A: Given: The length of plate glass part is uniformly distributed.
Q: 44. The following stem-and-leaf plot was found to display information regarding the number of girls…
A:
Q: 7.37 Let x₁,...,xn be the observed values of a random sample of size n from the exponential…
A:
Q: Sacks of grain have an average weight of 120 Kilograms. It is found that 10% of the bags are over…
A: let X: weight of the bags.X~N(μ,σ)where mean(μ)=120 kg.and given P(X>125)=10%=0.10 find…
Q: 1. A line was measure with a steel tape as follows: Trial 1 2 3 4 5 Solve for: a. Most probable…
A: “Since you have posted a question with multiple sub-parts, we will solve first three subpartsfor…
Q: 6. A tennis player makes a successful first serve 60% of the time. Assume that each serve is…
A: As per our guidelines we are suppose to answer only one question. Given,n=8p=0.6q=1-0.6=0.4A random…
Q: Consider the binary communication channel shown in Fig. 4.9. Let X, Ybe random variables, where X is…
A:
Q: Using the following stem & leaf plot, find the five number summary for the data by hand. 1|4 6 2|2…
A: In the stem-and-leaf plot, the data is arranged in ascending order.
Q: Consider a drug that is used to help prevent blood clots in certain patients. In clinical trials,…
A: Given X=150 n=6197 Alpha=0.01
Q: The Human ager of a company employing 200 workers conducts a survey to investigate whether there is…
A: Correlation is a parametric associational statistic that is extensively used by the statistician to…
Q: A pool supply company sells 50-pound buckets of chlorine tablets. A customer believes that the…
A: Given information Hypothesized mean µ = 50 pounds Sample size (n) = 30 Mean x̅ = 49.4 pounds…
Q: The school registrar estimates that the dropout rate of senior high schools in Cavite is 75%. Last…
A: Given Information: Claim: Dropout rate of senior high schools in Cavite is 75% i.e., p=0.75 Sample…
This is my numerical numbers question. I hope you can help me.

Step by step
Solved in 2 steps with 3 images


- Zipfs Law The following table shows U.S cities by rank in terms of population and population in thousands. City Rank r Population N New York 1 8491 Chicago 3 2722 Philadelphia 5 1560 Dallas 9 1280 Austin 11 913 San Francisco 13 852 Columbus 15 836 A rule known as Zipfs law tells us that it is reasonable to approximate these data with a power function. a Use power regression to express the population as a function of the rank. b Plot the data along with the power function from part a. c Phoenix is the sixth largest city in the United States. Use your answer from part a to estimate population of Phoenix. Round your answer in thousands to the nearest whole number. Note: The actual population is 1537 thousand.XYZ Corporation Stock Prices The following table shows the average stock price, in dollars, of XYZ Corporation in the given month. Month Stock price January 2011 43.71 February 2011 44.22 March 2011 44.44 April 2011 45.17 May 2011 45.97 a. Find the equation of the regression line. Round the regression coefficients to three decimal places. b. Plot the data points and the regression line. c. Explain in practical terms the meaning of the slope of the regression line. d. Based on the trend of the regression line, what do you predict the stock price to be in January 2012? January 2013?Special Rounding Instructions. For this exercise set, round all regression parameters to three decimal places, but round all other answers to two decimal places unless otherwise indicated. Growth in Length of HaddockA study by Raitt showed that the maximum length that a haddock could be expected to grow is about 53centimeters.Let D=D(t) denote the difference between 53centimeters and the length at age t years. The table below gives experimentally collected values for D. Age t Difference D 2 28.2 5 16.1 7 9.5 13 3.3 19 1.0 a.Find an exponential model of D as a function of t. b.Let L=L(t) denote the length in centimeters of a haddock at age t years. Find the model for L as a function of t. c.Plot the graph of the experimentally gathered data for the length L at ages 2,5,7,13, and 19years along with the graph of the model you made for L. Does this graph show that the 5year old haddock is a bit shorter or a bit longer than would be expected? d.A fisherman has caught a haddock that measures 41centimeters. What is the approximate age of the haddock?
- Special Rounding Instructions For this exercise set, round all regression parameters to three decimal places, but round all other answers to two decimal places unless otherwise indicated. Gray Wolves in WisconsinGray wolves were among the first mammals protected under the Endangered Species Act in the 1970s. Wolves recolonized in Wisconsin beginning in 1980.Their population grew reliably after 1985 as follows: Year Wolves Year Wolves 1985 15 1993 40 1986 16 1994 57 1987 18 1995 83 1988 28 1996 99 1989 31 1997 145 1990 34 1998 178 1991 40 1999 197 1992 45 2000 266 a. Explain why an exponential model may be appropriate. b. Are these data exactly exponential? Explain. c. Find an exponential model for these data. d. Plot the data and the exponential model. e. Comment on your graph in part d. Which data points are below or above the number predicted by the exponential model?Olympic Pole Vault The graph in Figure 7 indicates that in recent years the winning Olympic men’s pole vault height has fallen below the value predicted by the regression line in Example 2. This might have occurred because when the pole vault was a new event there was much room for improvement in vaulters’ performances, whereas now even the best training can produce only incremental advances. Let’s see whether concentrating on more recent results gives a better predictor of future records. (a) Use the data in Table 2 (page 176) to complete the table of winning pole vault heights shown in the margin. (Note that we are using x=0 to correspond to the year 1972, where this restricted data set begins.) (b) Find the regression line for the data in part ‚(a). (c) Plot the data and the regression line on the same axes. Does the regression line seem to provide a good model for the data? (d) What does the regression line predict as the winning pole vault height for the 2012 Olympics? Compare this predicted value to the actual 2012 winning height of 5.97 m, as described on page 177. Has this new regression line provided a better prediction than the line in Example 2?Special Rounding Instructions For this exercise set, round all regression parameters to three decimal places, but round all other answers to two decimal places unless otherwise indicated. Postal RatesThe table below shows the cost s, in cents, of a domestic first-class postage stamp in the United States tyears after 1900. t=time,inyearssince1900 s=costofstamp 19 2 32 3 58 4 71 8 78 15 85 22 95 32 102 37 109 44 116 47 a.Use exponential regression to model s as an exponential function of t. b.What cost does your model give for a 1988 stamp? Report your answer to the nearest cent. The actual cost was 25cents. c.Plot the data and the exponential model.
- A Dubious Model of Oil Prices The following table shows the prices of oil in U.S. dollars per barrel, t years since 1990, One analysis involving additional data used a cubic equation to model this data. t Years since 1990 0 2 5 7 10 12 15 17 20 21 P Price, dollars per barrel 18.91 16.22 16.63 18.20 27.04 23.47 49.63 69.04 77.46 106.92 a. Use cubic regression to model these data. Round the regression parameters to four decimal places. b. Plot the data along with the cubic model. c. In the analysis mentioned above, the graph is expanded through 2020. Expand the viewing window to show the model from 1990 to 2020. d. What estimate does the model give for oil prices in 2015? e. The actual price of oil in December of 2015 was about 35 per barrel. What basic principle in the use of models would be violated in relying on the estimate in part d?Special Rounding Instructions. For this exercise set, round all regression parameters to three decimal places, but round all other answers to two decimal places unless otherwise indicated. Caloric Content Versus Shell Length In 1965, Robert T.Paine gathered data on the length L, in millimeters, of the shell and the caloric content C, in calories, for a certain mollusk. The table below is adapted from those data. L=length C=Calories 7.5 92 13 210 20 625 24 1035 31 1480 a.Find an exponential model of calories as a function of length. b.Plot the graph of the data and the exponential model. Which of the data points show a good deal less caloric content than the model would predict for the given length? c.If length is increased by 1millimeter, how is caloric content affected?Special Rounding Instructions For this exercise set, round all regression parameters to three decimal places, but round all other answers to two decimal places unless otherwise indicated. Design Patents The following table shows the number P of design patents awarded by the U.S. Patents and Trademark Office from 1950 through 2010. t = years since 1950 P = patents 0 4718 10 2543 20 3214 30 3949 40 8024 50 17,413 60 22,799 a.Use exponential regression to model P as a function of t. b.Plot the data along with the regression equation. c.In what years were there more patents awarded than might be expected from the model?
- The amount of gas used by a typical household in a week (Q, in litres) is found to have a strongcorrelation with the price of gas (P, in $). For 6 observations, the following data was collected:Q P11.4 4.0014 3.5016 3.0018 2.5020 2.00(a) Create a regression relationship for this data(b) Perform a hypothesis test to determine whether the slope coefficient obtained in part (a) above is statistically significant(c) Use the regression equation in part (a) above to predict the quantity of gas used by a household when the price is $3.75 per litre(d) Calculate the price elasticity of demand for gas at a price of $3.75 (e) Using a further calculation, discuss how well the regression equation in part (a) above fits the dataThe question asked "Calculate the best line of fit using linear regression. Type the equation y=mx+by=mx+b, substituting the correct m and b values in, for the answer. Round to two decimal places if necessary."The linear regression equation, Y = a + bX, was estimated. The following computer printout was obtained: DEPENDENT VARIABLE: Y R-SQUARE F-RATIO P-VALUE ON F OBSERVATIONS: 18 0.3066 7.076 0.0171 VARIABLE PARAMETER ESTIMATE STANDARD ERROR T-RATIO P-VALUE INTERCEPT 15.48 5.09 3.04 0.0008 X -21.36 8.03 -2.66 0.0171 Given the information in the table, the parameter estimate of b indicates


