Question(2): The following figures give the number of defectives in 20 samples, each sample containing 2000 items. 425 430 216 341 225 322 280 306 337 305 356 402 216 409 193 326 280 389 Calculate the values for centre line and the control limits for p chart. Draw the p-chart and comment if the process can be regarded in control or not?
Question(2): The following figures give the number of defectives in 20 samples, each sample containing 2000 items. 425 430 216 341 225 322 280 306 337 305 356 402 216 409 193 326 280 389 Calculate the values for centre line and the control limits for p chart. Draw the p-chart and comment if the process can be regarded in control or not?

Glencoe Algebra 1, Student Edition, 9780079039897, 0079039898, 2018
18th Edition
ISBN:9780079039897
Author:Carter
Publisher:Carter
Chapter10: Statistics
Section10.6: Summarizing Categorical Data
Problem 4CGP

Related questions
Question
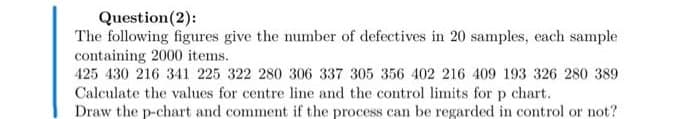
Transcribed Image Text:Question(2):
The following figures give the number of defectives in 20 samples, each sample
containing 2000 items.
425 430 216 341 225 322 280 306 337 305 356 402 216 409 193 326 280 389
Calculate the values for centre line and the control limits for p chart.
Draw the p-chart and comment if the process can be regarded in control or not?
Expert Solution
This question has been solved!
Explore an expertly crafted, step-by-step solution for a thorough understanding of key concepts.

Step by step
Solved in 2 steps with 1 images

Recommended textbooks for you
Glencoe Algebra 1, Student Edition, 9780079039897…
Algebra
ISBN:
9780079039897
Author:
Carter
Publisher:
McGraw Hill

Functions and Change: A Modeling Approach to Coll…
Algebra
ISBN:
9781337111348
Author:
Bruce Crauder, Benny Evans, Alan Noell
Publisher:
Cengage Learning
Glencoe Algebra 1, Student Edition, 9780079039897…
Algebra
ISBN:
9780079039897
Author:
Carter
Publisher:
McGraw Hill
Functions and Change: A Modeling Approach to Coll…
Algebra
ISBN:
9781337111348
Author:
Bruce Crauder, Benny Evans, Alan Noell
Publisher:
Cengage Learning