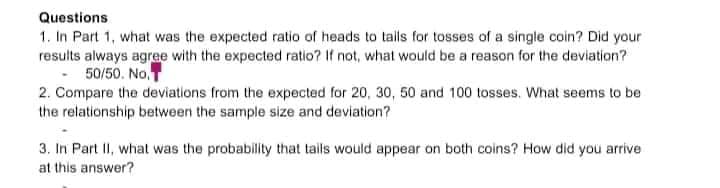
Questions 1. In Part 1, what was the expected ratio of heads to tails for tosses of a single coin? Did your results always agree with the expected ratio? If not, what would be a reason for the deviation? 50/50. No. 2. Compare the deviations from the expected for 20, 30, 50 and 100 tosses. What seems to be the relationship between the sample size and deviation? 3. In Part II, what was the probability that tails would appear on both coins? How did you arrive. at this answer?
Questions 1. In Part 1, what was the expected ratio of heads to tails for tosses of a single coin? Did your results always agree with the expected ratio? If not, what would be a reason for the deviation? 50/50. No. 2. Compare the deviations from the expected for 20, 30, 50 and 100 tosses. What seems to be the relationship between the sample size and deviation? 3. In Part II, what was the probability that tails would appear on both coins? How did you arrive. at this answer?

Glencoe Algebra 1, Student Edition, 9780079039897, 0079039898, 2018
18th Edition
ISBN:9780079039897
Author:Carter
Publisher:Carter
Chapter10: Statistics
Section10.4: Distributions Of Data
Problem 19PFA

Related questions
Question
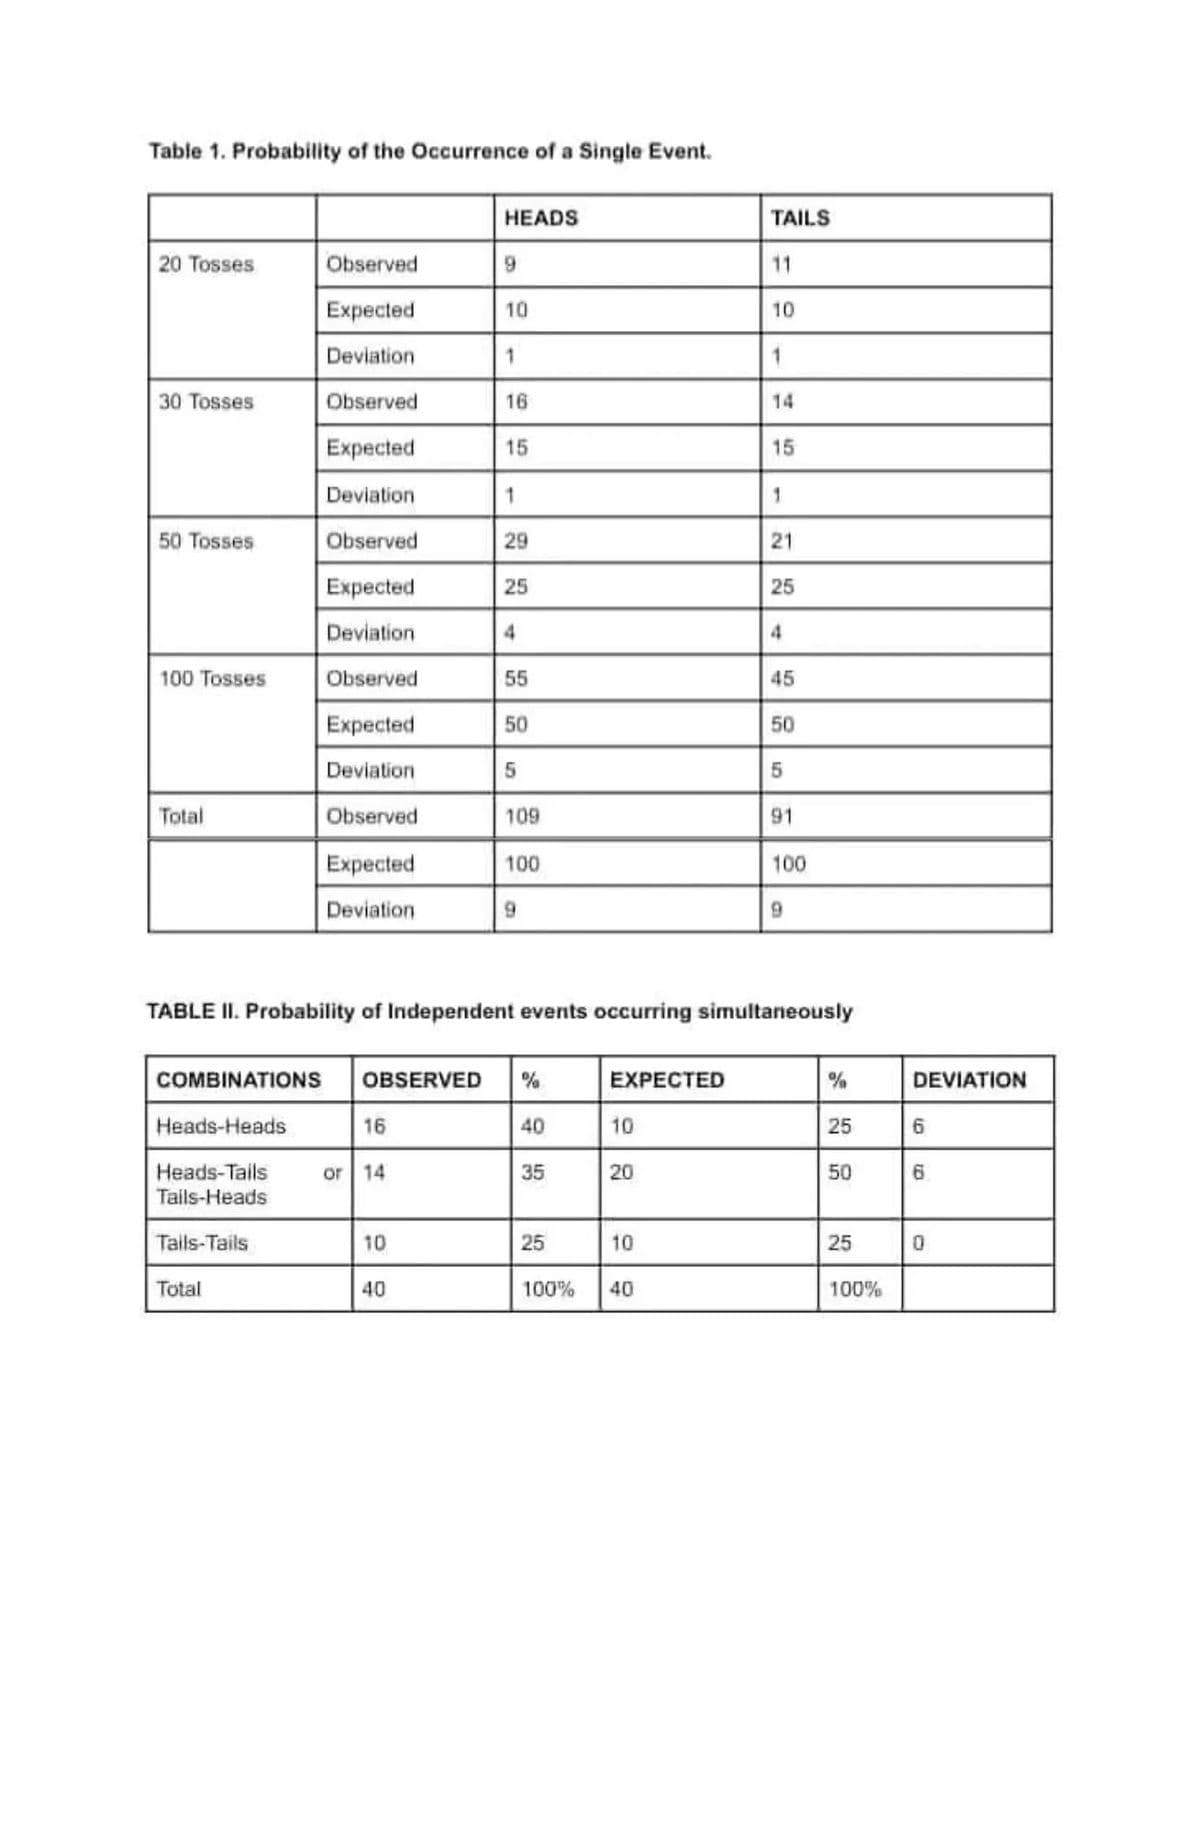
Transcribed Image Text:Table 1. Probability of the Occurrence of a Single Event.
20 Tosses
30 Tosses
50 Tosses
100 Tosses
Total
Observed
Expected
Deviation
Observed
Expected
Deviation
Observed
Expected
Deviation
Observed
Expected
Deviation
Observed
Expected
Deviation
Total
16
or 14
HEADS
10
9
40
10
1
16
15
1
29
25
4
55
50
5
COMBINATIONS OBSERVED %
Heads-Heads
Heads-Tails
Tails-Heads
Tails-Tails
109
100
9
40
35
25
EXPECTED
10
20
10
TAILS
100% 40
11
TABLE II. Probability of Independent events occurring simultaneously
10
1
15
1
21
25
4
45
50
5
91
100
9
%
25
50
25
100%
DEVIATION
6
6
0
Transcribed Image Text:Questions
1. In Part 1, what was the expected ratio of heads to tails for tosses of a single coin? Did your
results always agree with the expected ratio? If not, what would be a reason for the deviation?
- 50/50. No.
2. Compare the deviations from the expected for 20, 30, 50 and 100 tosses. What seems to be
the relationship between the sample size and deviation?
3. In Part II, what was the probability that tails would appear on both coins? How did you arrive
at this answer?
Expert Solution
This question has been solved!
Explore an expertly crafted, step-by-step solution for a thorough understanding of key concepts.

This is a popular solution!

Trending now
This is a popular solution!

Step by step
Solved in 4 steps

Recommended textbooks for you
Glencoe Algebra 1, Student Edition, 9780079039897…
Algebra
ISBN:
9780079039897
Author:
Carter
Publisher:
McGraw Hill
Glencoe Algebra 1, Student Edition, 9780079039897…
Algebra
ISBN:
9780079039897
Author:
Carter
Publisher:
McGraw Hill