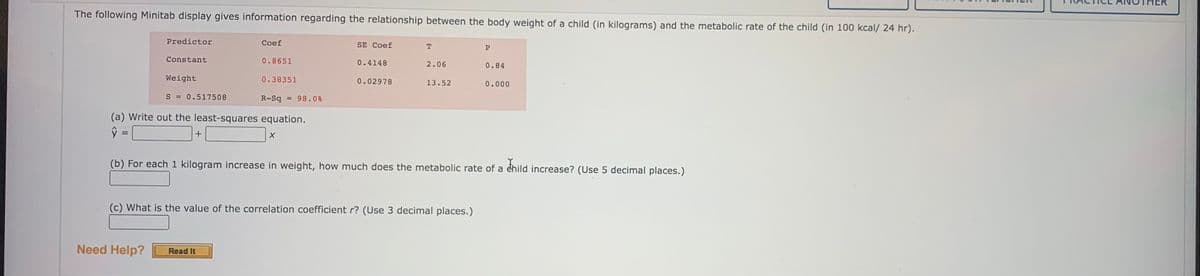
R-Sq- 98.ON (a) Write out the least-squares equation. (b) For each 1 kilogram increase in weight, how much does the metabolic rate of a child increase? (Use 5 decimal places.) (c) What is the value of the correlation coefficient r? (Use 3 decimal places.) Need Holn? Read t


Q: hr). weight of a child (in kilograms) and the metabolic rate of the child (in 100 kc Predietor Coet…
A:
Q: A study investigated how the content of vitamin A in carrots is affected by the time being cooked.…
A: The least regression equation for the relationship between X and Y is mentioned as; Y = 21.4 –…
Q: A recent study showed that the hours a person exercised in a week affected the individual's resting…
A: Given: r=-0.68 The regression equation is y=83-1.4(x). c. What does the value -1.4 tell you about…
Q: student studying statistics examined whether a relationship exists between the city miles per gallon…
A: a. The predicted highway mpg for a vehicle that gets an average of 24 miles per gallon when driving…
Q: Curing times in days (x) and compressive strengths in MPa (V) were recorded for several concrete…
A: Introduction: A simple linear regression equation is of the form:
Q: When a stone is dropped in a pond, ripples are formed and travel in concentric circles away from…
A: Regression equation of the log are is given by, log(Area) = 0.490 + 2.004 log(Time) So, log of area…
Q: Create a scatter plot for the data. Do you think there is a linear relationship between the two…
A: Step-by-step procedure to draw scatter plot using Excel: In Excel sheet, enter Expenditures per…
Q: Regression analysis was used to predict the body fat (%) on the chest size (inches). The resulting…
A:
Q: nen a stone is dropped in a pond, ripples are formed d travel in concentric circles away from where…
A: Y=mx+c Where c=constant m= regression coefficients of x
Q: 3 6 y |0.5 | 1.6 | 2.2 Which of the following is the coefficient a in the exponential function y =…
A:
Q: i. Find the equation of least squares regression line, ŷ = a + bx. ii. Find the linear correlation…
A:
Q: Interpreting technology: The following display from the TI-84 Plus calculator presents the…
A:
Q: The least squares regression line for the cost of a diamond necklace from a department store (y, in…
A: Interpretation of intercept y= a+bx It is expected value of y when all the value of x= 0 In the…
Q: (c) Use the least squares method to develop the estimated regression equation. (Round your numerical…
A: Step-by-step procedure to find the regression line using Excel: In Excel sheet, enter Price (x) and…
Q: b) Using the least-squares regression method, the equation for forecasting is (round your responses…
A: Owner of musical company thinks that demand of guitars is related to number of television…
Q: At a large state university, the Statistics department is interested in tracking the progress of its…
A: Given: Y=5.70+0.91X The slope of the regression line tells that how much change in Y is expected as…
Q: Advertisement ($'000) Sales ($'000) 1068 4489 1026 5611 767 3290 885 4113…
A: In this case, advertisement (x) is the independent variable and sales (y) is the dependent variable.
Q: Interpreting technology: The following display from the TI-84 Plus calculator presents the…
A: Regression:Regression is a technique that is used to determine relationship between two or more…
Q: Question Help v A student at a junior college conducted a survey of 20 randomly selected full-time…
A: Given, The least squares regression line is, The objective is to find the predict the…
Q: At a large state university, the Statistics department is interested in tracking the progress of its…
A: For dependent random variable y and the independent random variable x, the simple linear regression…
Q: End-of-year data for the number of Facebook users (in millions) from 2008 through 2011 are given in…
A: a) The least square regression line is obtained below: The required value will provide by the…
Q: An automotive engineer computed a least-squares regression line for predicting the gas mileage (y)…
A: Given : y = -0.14x + 38.78
Q: Find & practically interpret the correlation coefficient (r) Find & practically interpret the…
A: Since you have posted question with multiple subparts,we will solve first three subparts for you.To…
Q: 2.89 A property of the least-squares regression Use the equation for the least-squares regression to…
A: Suppose we are given a straight line y=a+bx , then we say that the line passes through the point…
Q: A study investigated how the content of vitamin A in carrots is affected by the time being cooked.…
A: The regression equation is given by, Y = 21.4-0..67X Here, X : Amount of time carrot slices were…
Q: (a) Find the least-squares regression line treating weight as the explanatory variable and miles per…
A: Given the data on weight of a gas powered car and gas mileage. The least square regression equation…
Q: ers correlate? Here are data on the heights (1H IIICIC3) UI Brother 71 68 66 67 70 71 70 73 72 65 66…
A: Let Y denote height of brother X denote height of sister. We have to calculate line of regression…
Q: aterpreting technology: A business school professor computed a least-squares regression line for…
A:
Q: Term Coef SECoef T-Value P-Value Constant 10834 9716 1.12 0.274 Wins 235 119 1.98 0.058 S=7,377…
A: If the point representing 64 wins and attendance of 40,786 people per game is removed from the set…
Q: recent study showed that the hours a person exercised in a week affected the individual's resting…
A: Solution: Given information: r= -0.68 Correlation coefficient The least square regression line is…
Q: The proportion of the variation in the values of a response y that is explained by the least-squares…
A: Identify the correct option for the given statement. The correct option is identified below as…
Q: End-of-year data for the number of Facebook users (in millions) from 2008 through 2011 are given in…
A: From given data, X Y X*Y X*X 0 154.5 0 0 1 381.8 381.8 1 2 654.5 1309 4 3 845 2535 9
Q: Predictor Coef SE Coef P Constant 0.8381 0.4148 2.06 0.84 Weight 0.40619 0.02978 13.52 0.000 S-…
A: Given βo=0.8381, β1=0.40619 R2=94.2%=0.942
Q: A regression was run to determine if there is a relationship between the happiness index (y) and…
A:
Q: The scatterplot below displays the relationship between two quantitative variables, x and y. The…
A: The equation of the least-squares regression line is y = 15.682 + 5.767x. From the scatter plot,…
Q: ly 1) Find the least squares line 2) Find the coefficient of correlation 3/08
A:
Q: We use the form y = a + bx for the least-squares line. In some computer printouts, the least-squares…
A: The intercept is 315.54 and the slope is -28.950.
Q: Interpreting technology: The following MINITAB output presents the least-squares regression line for…
A: Given The output from MINITAB is as follows:
Q: a. Find the equation of the least squares line . Round a and b to three decimal places. b. Find the…
A: (a) Use EXCEL to determine the regression equation. EXCEL procedure: Go to EXCEL Go to…
Q: Question Help v A student at a junior college conducted a survey of 20 randomly selected full-time…
A: Given regression equation isy=-0.0552x+2.9446a) If x=8y=?
Q: The r^-2 values representing the coefficients of determination for the least squares linear model…
A: Given that, The r^-2 values representing the coefficients of determination for the least squares…
Q: A biologist collected data on a sample of 20 porcupines. She wants to be able to predict the body…
A:
Q: To earn full credit for this question, use your own sheet of paper to solve the problem, showing all…
A:
Q: ff data gives the approximate population of China from 1990-2010 Year 1900 1950 1970 1980 1990 2000…
A:
Q: A recent study showed that the hours a person exercised in a week affected the individual's resting…
A: Given Information: A recent study showed that the hours a person exercised in a week affected the…
Q: A study investigated how the content of vitamin A in carrots is affected by the time being cooked.…
A: Consider, the regression equation as y=a+bx Here, y represents the dependent variable x represents…
Q: Interpreting technology: The following display from the TI-84 Plus calculator presents the…
A:
Q: (b) Find the equation of the least-squares line. (Round your answers to two decimal places.) (c)…
A: given x y 1 13.8 2 20.5 3 14.4 4 19.6 5 20
Q: a) Use a calculator or computer to find the least squares regression line, y = mx + b, where the…
A: The data of 10 students is given about their IQ and number of hours of TV they watch per week. The…


Trending now
This is a popular solution!

Step by step
Solved in 4 steps with 4 images

- A 2017 survey of over 5,000 college graduates found that the average graduated from a four-year college or university had an average student loan debt of $28,650 (s.d. = $3,280). Assuming that educational debt is normally distributed, calculate the percentile rank of a recent graduate who graduated with $35,636 in education-related debt.Suppose an experiment finds that people taking a new herbal remedy get fewer colds than people taking a placebo. The results are statistically significant at the 0.01 level. Has the experiment proven that the herbal remedy works?A survey of 90 recently delivered women on the rolls of a county welfare department revealed that 27 had a history of intrapartum or postpartum infection. What is the critical value of z if we need to conclude that the population proportion with a history of intrapartum or postpartum infection is less than 0.25.
- In response to concerns about nutritional contents of fast foods, McDonald’s announced that it would use a new cooking oil for its french fries that would decrease substantially trans fatty acid levels and increase the amount of more beneficial poly-unsaturated fat. The company claimed that 97 out of 100 people cannot detect a difference in taste between the new and old oils. Assuming that this figure is correct (as a long-run proportion). Let X denote the number of individuals who can taste the difference between the two oils in a random sample of 1000 individuals who have purchased fries at McDonald’s. If it turns out that 65 individuals in the sample can taste the difference between the two oils, would you question McDonald’s claim? Explain why or why not.In response to concerns about nutritional contents of fast foods, McDonald’s announced that it would use a new cooking oil for its french fries that would decrease substantially trans fatty acid levels and increase the amount of more beneficial poly-unsaturated fat. The company claimed that 97 out of 100 people cannot detect a difference in taste between the new and old oils. Assuming that this figure is correct (as a long-run proportion). Let X denote the number of individuals who can taste the difference between the two oils in a random sample of 1000 individuals who have purchased fries at McDonald’s Find the Distribution of X.In response to concerns about the nutritional contents of fast foods, McDonald’s announced that it would use new cooking oil for its french fries that would decrease substantially trans fatty acid levels and increase the amount of more beneficial poly-unsaturated fat. The company claimed that 97 out of 100 people cannot detect a difference in taste between the new and old oils. Assuming that this figure is correct (as a long-run proportion). Let X denote the number of individuals who can taste the difference between the two oils in a random sample of 1000 individuals who have purchased fries at McDonald’s. Use the normal approximation with continuity correction to find the probability that at most 5% can taste the difference between the two oils.
- A doctor is using a growth chart for baby girls that indicates a 12-month-old baby girl has a mean weight of 21.1 pounds with a standard deviation of about 2.29 pounds. Assume that the weights are approximately normally distributed. What proportion of 12-month-old baby girls weigh between 19.62 and 22.17 pounds?Beta company is manufacturing steel wire with an average tensile and strenght of 50 kilos. The laboratory tests 16 pieces and finds that the mean is 47 kilos and the standard deviation of is 15 kilos. Are the reuslts in accordance with the hypothesis that the population mean is 50 kilos.A group of 10-year-old boys were first ascertained in a camp for diabetic boys. They had their weight measured at baseline and again when they returned to camp 1 year later. Each time, a serum sample was obtained from which a determination of hemoglobin A1c (HgbA1c) was made. HgbA1c (also called glycosylated hemoglobin) is routinely used to monitor compliance with taking insulin injections. Usually, the poorer the compliance, the higher the HgbA1c level will be. The hypothesis is that the level HgbA1c is related to weight. The data in Table 11.28 were obtained. 11.92 What test can be performed to assess the relationship between weight and HgbA1c at the initial visit? 11.93 Please perform the test in Problem 11.92, and report a two-tailed p-value. 11.94 Do the results in Problem 11.93 imply a relationship between change in HgbA1c and change in weight for an individual boy? Why or why not?
- A group of 10-year-old boys were first ascertained in a camp for diabetic boys. They had their weight measured at baseline and again when they returned to camp 1 year later. Each time, a serum sample was obtained from which a determination of hemoglobin A1c (HgbA1c) was made. HgbA1c (also called glycosylated hemoglobin) is routinely used to monitor compliance with taking insulin injections. Usually, the poorer the compliance, the higher the HgbA1c level will be. The hypothesis is that the level HgbA1c is related to weight. The data in Table 11.28 were obtained. 11.95 Compute a rank correlation between change in weight and change in HgbA1c, each over 1 year. Use this measure to directly test the hypothesis that change in weight over 1 year is related to change in HgbA1c. Report a two-tailed p-value, and provide a 95% confidence interval for the underlying rank correlation.A group of 10-year-old boys were first ascertained in a camp for diabetic boys. They had their weight measured at baseline and again when they returned to camp 1 year later. Each time, a serum sample was obtained from which a determination of hemoglobin A1c (HgbA1c) was made. HgbA1c (also called glycosylated hemoglobin) is routinely used to monitor compliance with taking insulin injections. Usually, the poorer the compliance, the higher the HgbA1c level will be. The hypothesis is that the level HgbA1c is related to weight. The data in Table 11.28 were obtained.11.92 What test can be performed to assess the relationship between weight and HgbA1c at the initial visit?11.93 Please perform the test in Problem 11.92, and report a two-tailed p-value.11.94 Do the results in Problem 11.93 imply a relationship between change in HgbA1c and change in weight for an individual boy? Why or why not?11.95 Compute a rank correlation between change in weight and change in HgbA1c, each over 1 year. Use…A group of 10-year-old boys were first ascertained in a camp for diabetic boys. They had their weight measured at baseline and again when they returned to camp 1 year later. Each time, a serum sample was obtained from which a determination of hemoglobin A1c (HgbA1c) was made. HgbA1c (also called glycosylated hemoglobin) is routinely used to monitor compliance with taking insulin injections. Usually, the poorer the compliance, the higher the HgbA1c level will be. The hypothesis is that the level HgbA1c is related to weight. The data in Table 11.28 were obtained.11.94 Do the results in Problem 11.93 imply a relationship between change in HgbA1c and change in weight for an individual boy? Why or why not?11.95 Compute a rank correlation between change in weight and change in HgbA1c, each over 1 year. Use this measure to directly test the hypothesis that change in weight over 1 year is related to change in HgbA1c. Report a two-tailed p-value, and provide a 95% confidence interval for the…