11.92 What test can be performed to assess the relationship between weight and HgbA1c at the initial visit? 11.93 Please perform the test in Problem 11.92, and report a two-tailed p-value.


Continuous Probability Distributions
Probability distributions are of two types, which are continuous probability distributions and discrete probability distributions. A continuous probability distribution contains an infinite number of values. For example, if time is infinite: you could count from 0 to a trillion seconds, billion seconds, so on indefinitely. A discrete probability distribution consists of only a countable set of possible values.
Normal Distribution
Suppose we had to design a bathroom weighing scale, how would we decide what should be the range of the weighing machine? Would we take the highest recorded human weight in history and use that as the upper limit for our weighing scale? This may not be a great idea as the sensitivity of the scale would get reduced if the range is too large. At the same time, if we keep the upper limit too low, it may not be usable for a large percentage of the population!
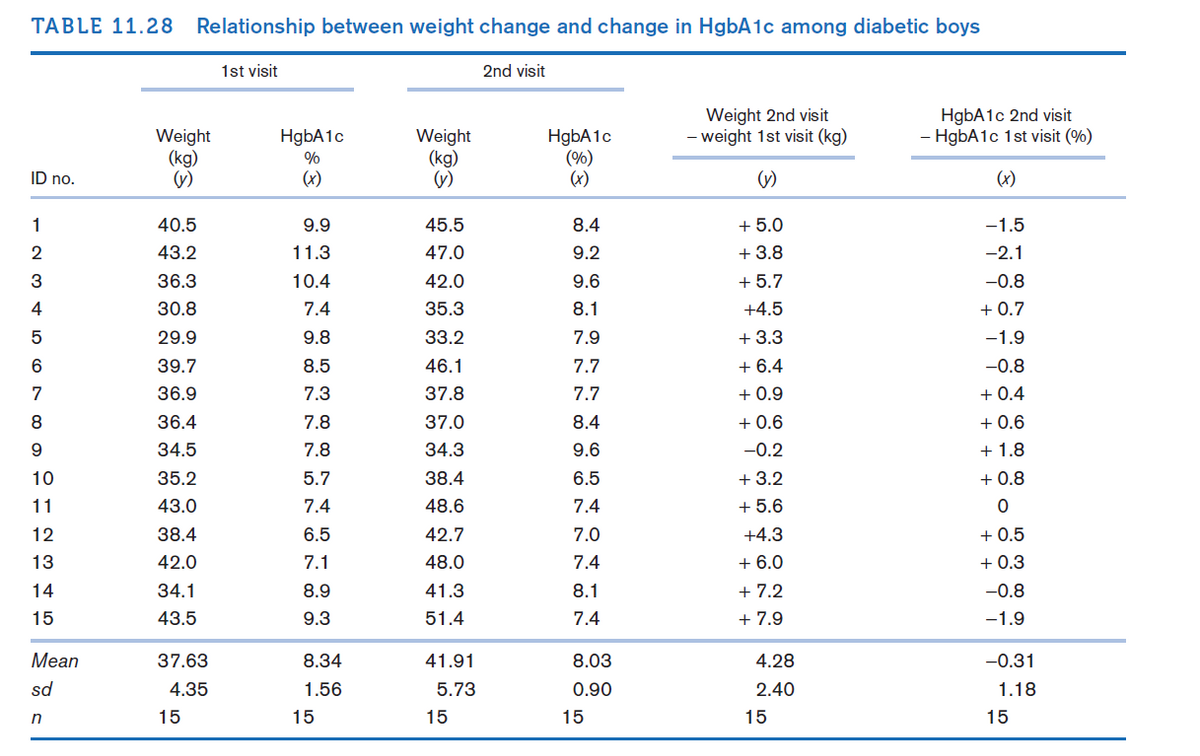
A group of 10-year-old boys were first ascertained in a camp for diabetic boys. They had their weight measured at baseline and again when they returned to camp 1 year later. Each time, a serum sample was obtained from which a determination of hemoglobin A1c (HgbA1c) was made. HgbA1c (also called glycosylated hemoglobin) is routinely used to monitor compliance with taking insulin injections. Usually, the poorer the compliance, the higher the HgbA1c level will be. The hypothesis is that the level HgbA1c is related to weight. The data in Table 11.28 were obtained.
11.92 What test can be performed to assess the relationship between weight and HgbA1c at the initial visit?
11.93 Please perform the test in Problem 11.92, and report a two-tailed p-value.
11.94 Do the results in Problem 11.93 imply a relationship between change in HgbA1c and change in weight for an individual boy? Why or why not?
11.95 Compute a rank


Trending now
This is a popular solution!

Step by step
Solved in 2 steps with 8 images


