Random samples of 110 homes in Kingston, Ontario (n1) and 100 homes in Owen Sound, Ontario (n2) were selected. Each home was examined or the presence of asbestos, and it was found that 20 homes in Owen Sound and 35 homes in Kingston had some presence of asbestos. We would like to test whether the proportion of homes with asbestos in Kingston (p1) is greater than the proportion of homes in Owen Sound with asbestos (p2). What test statistic should we use? Here, we will denote by p the proportion of homes with asbestos in Kingston and Owen Sound combined. Select one: O a. Z = N (0, 1) V(P,(1-P1)/n1+P2(1-p2)/n2) O b. x? = £ (E–Ok)² Xỉ, where E is the expected number of observations, and Or is the actual number of observations, in the cells of the contingency table corresponding to this problem. Pi-P2 V(6(1-p)(1/n1+1/n2) O c. Z = N (0,1) We would next like to construct a 95% confidence interval for the difference P1 – P2- What is the lower endpoint of this confidence interval? Give answer to 3 decimal places. What is the upper endpoint of this confidence interval? Give answer to 3 decimal places.
Random samples of 110 homes in Kingston, Ontario (n1) and 100 homes in Owen Sound, Ontario (n2) were selected. Each home was examined or the presence of asbestos, and it was found that 20 homes in Owen Sound and 35 homes in Kingston had some presence of asbestos. We would like to test whether the proportion of homes with asbestos in Kingston (p1) is greater than the proportion of homes in Owen Sound with asbestos (p2). What test statistic should we use? Here, we will denote by p the proportion of homes with asbestos in Kingston and Owen Sound combined. Select one: O a. Z = N (0, 1) V(P,(1-P1)/n1+P2(1-p2)/n2) O b. x? = £ (E–Ok)² Xỉ, where E is the expected number of observations, and Or is the actual number of observations, in the cells of the contingency table corresponding to this problem. Pi-P2 V(6(1-p)(1/n1+1/n2) O c. Z = N (0,1) We would next like to construct a 95% confidence interval for the difference P1 – P2- What is the lower endpoint of this confidence interval? Give answer to 3 decimal places. What is the upper endpoint of this confidence interval? Give answer to 3 decimal places.

Glencoe Algebra 1, Student Edition, 9780079039897, 0079039898, 2018
18th Edition
ISBN:9780079039897
Author:Carter
Publisher:Carter
Chapter10: Statistics
Section10.6: Summarizing Categorical Data
Problem 30PPS

Related questions
Question
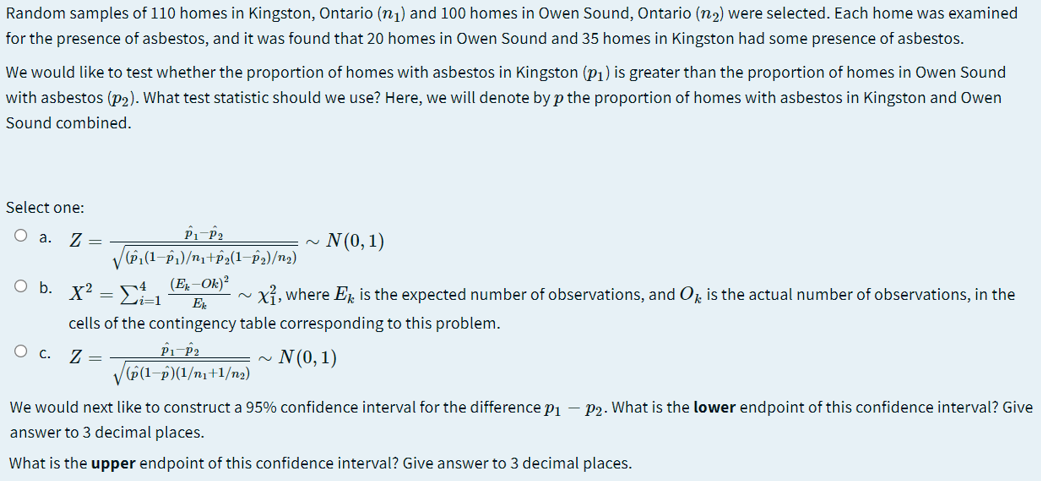
Transcribed Image Text:Random samples of 110 homes in Kingston, Ontario (n1) and 100 homes in Owen Sound, Ontario (n2) were selected. Each home was examined
for the presence of asbestos, and it was found that 20 homes in Owen Sound and 35 homes in Kingston had some presence of asbestos.
We would like to test whether the proportion of homes with asbestos in Kingston (P1) is greater than the proportion of homes in Owen Sound
with asbestos (p2). What test statistic should we use? Here, we will denote by p the proportion of homes with asbestos in Kingston and Owen
Sound combined.
Select one:
O a. Z =
N (0,1)
(P,(1-p1)/n,+p2(1–p2)/n2)
O b. X2 =
(E–Ok)²
Xỉ, where Er is the expected number of observations, and Or is the actual number of observations, in the
Е
cells of the contingency table corresponding to this problem.
Pi-Pa
V6(1-p)(1/n1+1/n2)
O c. Z =
N (0, 1)
We would next like to construct a 95% confidence interval for the difference p – P2. What is the lower endpoint of this confidence interval? Give
answer to 3 decimal places.
What is the upper endpoint of this confidence interval? Give answer to 3 decimal places.
Expert Solution
This question has been solved!
Explore an expertly crafted, step-by-step solution for a thorough understanding of key concepts.

Step by step
Solved in 2 steps with 2 images

Recommended textbooks for you
Glencoe Algebra 1, Student Edition, 9780079039897…
Algebra
ISBN:
9780079039897
Author:
Carter
Publisher:
McGraw Hill

College Algebra (MindTap Course List)
Algebra
ISBN:
9781305652231
Author:
R. David Gustafson, Jeff Hughes
Publisher:
Cengage Learning

Holt Mcdougal Larson Pre-algebra: Student Edition…
Algebra
ISBN:
9780547587776
Author:
HOLT MCDOUGAL
Publisher:
HOLT MCDOUGAL
Glencoe Algebra 1, Student Edition, 9780079039897…
Algebra
ISBN:
9780079039897
Author:
Carter
Publisher:
McGraw Hill
College Algebra (MindTap Course List)
Algebra
ISBN:
9781305652231
Author:
R. David Gustafson, Jeff Hughes
Publisher:
Cengage Learning
Holt Mcdougal Larson Pre-algebra: Student Edition…
Algebra
ISBN:
9780547587776
Author:
HOLT MCDOUGAL
Publisher:
HOLT MCDOUGAL
