randomly select two socks, one at a time. Calculate the following probabilities, writing your answer either as a decimal or a fraction. (a) What is the probability that you get a blue pair of socks? (b) What is the probability that you do not get a blue pair of
randomly select two socks, one at a time. Calculate the following probabilities, writing your answer either as a decimal or a fraction. (a) What is the probability that you get a blue pair of socks? (b) What is the probability that you do not get a blue pair of

Holt Mcdougal Larson Pre-algebra: Student Edition 2012
1st Edition
ISBN:9780547587776
Author:HOLT MCDOUGAL
Publisher:HOLT MCDOUGAL
Chapter11: Data Analysis And Probability
Section11.8: Probabilities Of Disjoint And Overlapping Events
Problem 2C

Related questions
Question
100%
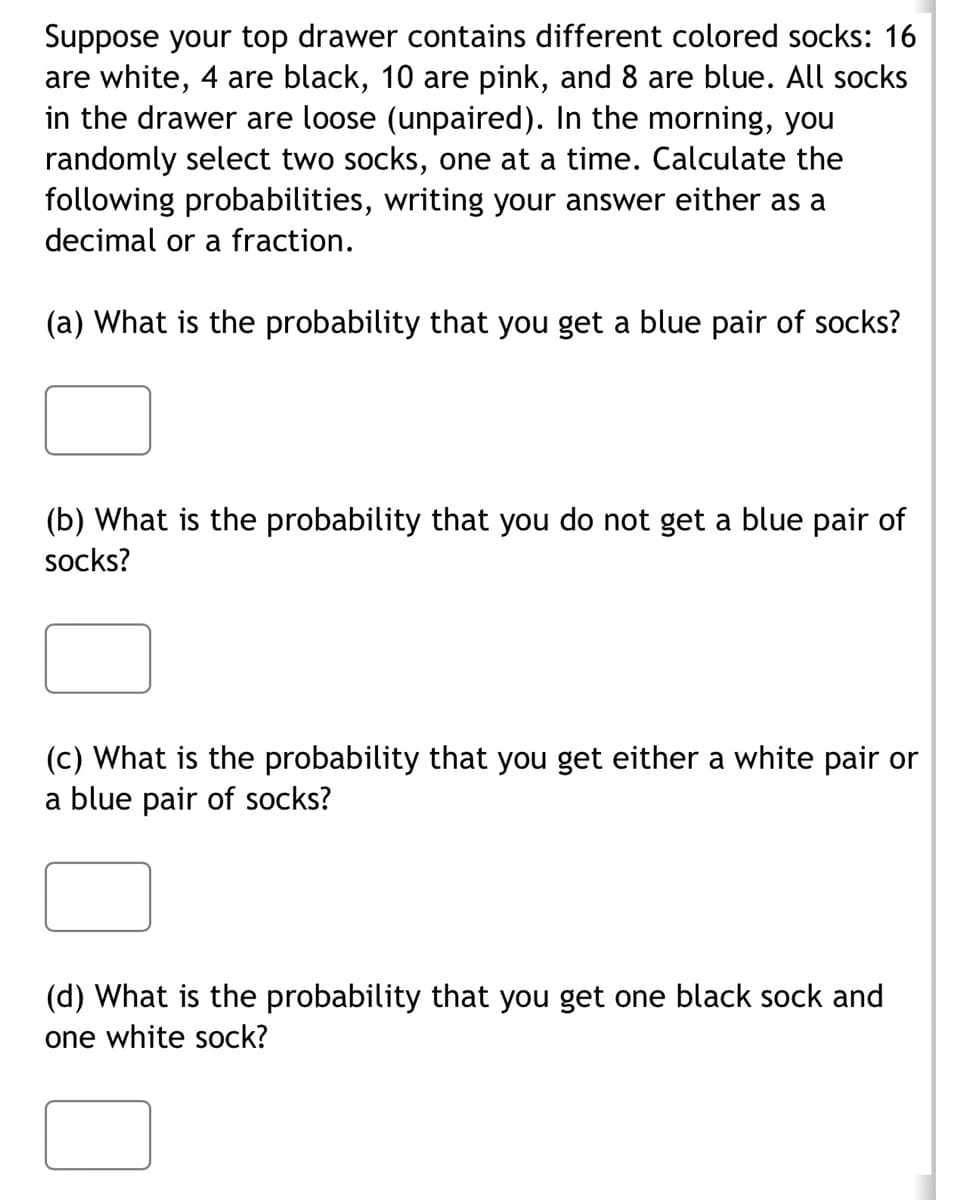
Transcribed Image Text:Suppose your top drawer contains different colored socks: 16
are white, 4 are black, 10 are pink, and 8 are blue. All socks
in the drawer are loose (unpaired). In the morning, you
randomly select two socks, one at a time. Calculate the
following probabilities, writing your answer either as a
decimal or a fraction.
(a) What is the probability that you get a blue pair of socks?
(b) What is the probability that you do not get a blue pair of
socks?
(c) What is the probability that you get either a white pair or
a blue pair of socks?
(d) What is the probability that you get one black sock and
one white sock?
Expert Solution
This question has been solved!
Explore an expertly crafted, step-by-step solution for a thorough understanding of key concepts.

Step by step
Solved in 2 steps

Recommended textbooks for you
Holt Mcdougal Larson Pre-algebra: Student Edition…
Algebra
ISBN:
9780547587776
Author:
HOLT MCDOUGAL
Publisher:
HOLT MCDOUGAL
Holt Mcdougal Larson Pre-algebra: Student Edition…
Algebra
ISBN:
9780547587776
Author:
HOLT MCDOUGAL
Publisher:
HOLT MCDOUGAL