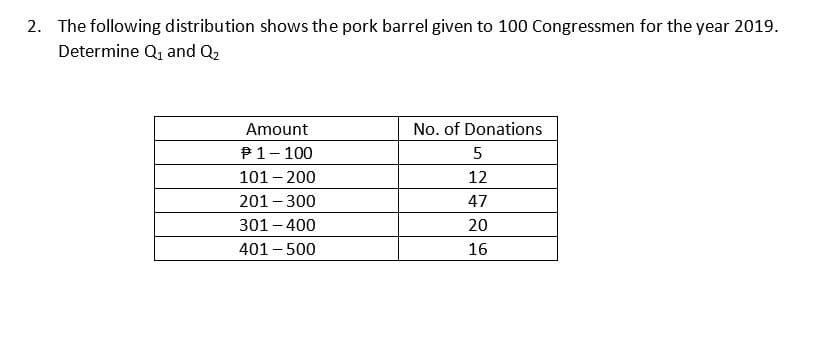
2. The following distribution shows the pork barrel given to 100 Congressmen for the year 2019. Determine Q₁ and Q₂ Amount P 1-100 101-200 201-300 301-400 401 - 500 No. of Donations 5 12 47 20 16


Q: Instructions: Critique the graph and indicate the flaw. NCR CAR Ollocos Region Cagayan Valley…
A: Given information: Type of graph: Pie chart Topic: Annual per capita Poverty thresholds of family by…
Q: The following data represent the times in minutes required for 18 co-workers to commute to work. V…
A:
Q: If Q1 is the value for which 25% of observations are smaller, then A. Only 25% of the observations…
A: Three values, i.e., Q1, Q2 and Q3 called quartiles, divide sorted data into four equal portions with…
Q: Find the interquartile range and quartile deviation for the data in (a) Table 2.29 and (b) Table…
A: Hint: First convert the given series into exclusive type and then calculate Q1 and Q3 as;…
Q: The stem-and-leaf plot shows house sale prices over the last week in Tacoma. The stem is in hundres…
A: Stem and leaf plot is given. 0|667778999 1|02447778889999 2|0011234445667889 3|00011223
Q: A shirt manufacturer buys cloth by the 100-yard roll from a supplier. For setting up a control chart…
A:
Q: a. Show tabular computations here b. Show complete solution of the sample coefficient here: (Sxy,…
A: Given that X Y 30 28 50 25 40 25 55 23 30 30 25 32 60 21 25 35 50 26 55 25
Q: Suppose theet Y₁, ½ Im and XwX₂- independent normally distributed from populations with mear…
A:
Q: e below gives the r region. nber of elementary school struct a cumulative frequency distribution.…
A: “Since you have posted a question with multiple sub-parts, we will solve first three subparts for…
Q: 2. The Department of Trade and Industry reported that the mean retail price per gallon of a certain…
A: Let X be the retail price per gallon follow normal distribution
Q: c. What percent of the students spent between 50 and 60 minutes on social media? 0 % d. What percent…
A: Given data is Class Interval Frequency Relative Frequency Cumulative Frequency Cumulative…
Q: The following data represent the amount of time (in minutes) a random sample of eight students took…
A: We have given data x 67.5 80.8 89.9 104.5 128.4 94.4 94.7 125.8 ∑x =786
Q: 2. The Department of Trade and Industry reported that the mean retail price per gallon of a certain…
A: Let X be the retail price per gallon follow normal distribution
Q: Suppose 2% of cotton fabric rolls and 3% of nylon fabric rolls contain flaws. Of the rolls used by a…
A: Given that P(C ) =0.70,P(N) =0.30 P(F/C) =0.02,P(F/N) =0.03 P( no flaws ) =?
Q: 0.5 X=1.8 X = 2 S = 0.5 S = Z=
A: Ans#- Given, X¯ = 2, S = 0.5 and X = 1.8 Find Z = ?
Q: Use the rules of expectations to show that Var(X + Y ) = Var(X) + Var(Y ) + 2Cov(X,Y )
A: Formula Used: Var(X) = EX2 - EX2 ............Equation (1) Cov(X, Y) = EXY -…
Q: 4) Which among the following experimental set-ups (a, b, c) have a lesser experimental error?…
A: Experimental error: It is an important term used in Design of experiments. Itmay be defined as the…
Q: The means and standard deviations are given in the data table. With a correlation of 0.826,…
A: Given: Correlation coefficient r = 0.826 Mean of Dose X = 1.651 The standard deviation of Dose SX =…
Q: Find the percentage of students that scores higher than 95.5 round your answer to the nearest…
A: From the given histogram we have to find percentage of students that scores higher than 95.5
Q: from populations with means μ₁ = 2 and M₂ = 8 and variances ₁² = 5 and σ₂² = k, respectively.…
A: Solution
Q: Using a sample of recent college graduates, Dr. Harrison performs a regression analysis to study the…
A: Regression analysis is used to estimate a model which shows the relationship between the independent…
Q: a. Show tabular computations here b. Show complete solution of the sample coefficient here: (Sxy,…
A: Given that X Y 30 28 50 25 40 25 55 23 30 30 25 32 60 21 25 35 50 26 55 25
Q: Eighteen cyclists were each asked the number of miles they biked last week. Their responses are…
A: We have given the following data 4,5,18,2,3,5,24,9,24,10,19,11,22,3,4,2,9,6 2, 2, 3, 3, 4, 4, 5, 5,…
Q: #1 only
A: Given that p = 0.02 p : probability of connecting a call X ~ Geometric(p = 0.02) Probability mass…
Q: Find Decile 1 and Decile 2 and base your answer from the formula provided.
A:
Q: The graph illustrates a normal distribution for the prices paid for a particular model of HD…
A:
Q: The brain volumes (cm^3) of 20 brains have a mean of 1128.8 cm^3 and a standard deviation of 129.3…
A: Formula : significantly low value=μ - 2*σ
Q: A Filipino maize breeder who is apprehensive about the low rate of adoption of new high-yielding…
A: Given information: A maize breeder is apprehensive about the low acceptance of new high yielding…
Q: 4. Pg. 59, 1. 7. 19. * Find the 65th of the distribution having pot F(x) = 1x114₂ where -a, < x <a,…
A: Given pdf of X is f(x)=|x|4, -2<x<20,elsewhere We have to find the 65th percentile of X.
Q: Battery life is an important issue for many smartphone owners. Public health studies have examined…
A: From the provided information, The data values are as follow: Primary use: Talking 35.8 22.2 24.0…
Q: μ = 37 =8 X = 34 N Z =
A: given data μ = 37σ = 8x = 34Z = ?
Q: from the
A: The standard deviation and average deviation, are two of the most frequently used measures for…
Q: 5. Suppose that A C B and that P(A) > 0 and P(B) < 1. Are A and B indepen- dent? Prove your answer.
A: Ans#-5; Given that A ⊂B, P(A) > 0, and P(B) <1 Are A and B independent?
Q: X only if Y expresses that Y is a necessary condition for X X is a necessary condition for Y X is…
A: X only if y It means X can occur only if y has occured. X can happen only when we have y.
Q: Find the Mean, Median, and Mode for Ungrouped and Grouped Data of the given data set. 55 57 58 58…
A: Given data…
Q: According to Masterfoods, the company that manufactures M&M’s, 12% of peanut M&M’s are brown, 15%…
A: GivenP(Peanut of M&M's are brown)=0.12P(Peanut of M&M's are yellow)=0.15P(Peanut of…
Q: Find the value of 80th percentile Find D5 Find Q1
A: Since you have posted a question with multiple sub-parts, we will solve first three subparts for…
Q: a. How many class intervals were used in the histogram? OE b. How many students wrote midterm exam?…
A: class frequency 10-15 1 15-20 3 20-25 0 25-30 24 30-35 28 35-40 19 40-45 25
Q: Consider the following population: {6, 7, 8, 9). For this population the mean is μ = Suppose that a…
A: Given data, Population = {6,7,8,9}. Population mean is given as 7.5. Provided possible samples are…
Q: 3) Differentiate replication and ranndomization.
A: Given that We have to differentiate between randomisation and replication
Q: 4) Which among the following experimental set-ups (a, b, c) have a lesser experimental error?…
A: Experimental error: This term is vaguely used in Design of experiments. It may be defined as the…
Q: Scores on this year's statistics midterm were normally distributed with a mean of 77.6 and a…
A: GivenMean(μ)=77.6standard deviation(σ)=3.4
Q: In a certain city, the average 20- to 29-year old man is 72.5 inches tall, with a standard deviation…
A: Given: For men: Mean μ = 72.5 Standard deviation σ = 3.2 For women: Mean μ = 64.3 Standard deviation…
Q: Frequency 247 20 16 12 8- 4 0+ 70.5 10 75.5 Prealgebra Exam Scores 4 80.5 19 85.5 Scores 17 90.5 15…
A: we have to find number of class containing largest number of exam scores.
Q: What is the probability that a randomly selected individual is more likely to buy a product…
A: Given: Purchase like 18-34 35-44 45-54 55+ Total More Likely 226 385 397 400 1408 Less Likely…
Q: Calculate the mode of this data list 81 99 16 54 13 25 62 6 6 39 62 6
A: Given: X Ordered data 62 6 6 6 6 6 39 13 62 16 6 25 49 39 93 39 93 49 39 54…
Q: 63 68 65 79 95 79 77 98 61 80 79 78 64 87 83 64 74 78 79 92 85 71 79 77 79 87 62 67 71 76 You are…
A: Here, Stem values are the face values of the digits in tenth place. Leaf values are the face values…
Q: Use correlation coefficients to determine which of the given sets of data is best fit by its…
A: Given: Dataset 1 x y -1 1 0 2 3 4 Dataset 2 x y -2 -3 0 -1 1 2 Dataset 3…
Q: 5. The grade point average (GPA) for college students is based on a weighted mean computation. For…
A: Given data: Grades(x): A(4), B(3), C(2), D(1) and F(0) Credits hours earned by student(w) for each…
Q: Page 3 of 5 3. Construct the graphs below using the table provided. Frequency 2 5 6 1 Class…
A: Given information: Class boundaries Frequency 39.5 to 44.5 2 44.5 to 49.5 5 49.5 to 54.5 6…

Step by step
Solved in 3 steps

- What is a sample space?A researcher read that firearm-related deaths for people aged 1 to 18 years were distributed as follows: 74% were accidental, 16% were homicides, and 10% were suicides. In her district, there were 68 accidental deaths, 27 homicides, and 5 suicides during the past year. At α = 0.10, test the claimFind the mode of the following amounts (in thousands of dollars) in checking accounts of randomly selected people aged 20-25. 2,4,4,7,2,9,9,2,4,4,11
- The table shows the annual compensation of 40 randomly chosen CEOs (millions of dollars). 4.91 1.79 23.00 7.34 13.40 5.22 2.22 4.94 193.74 16.26 24.98 8.68 10.19 16.34 2.59 3.62 86.09 13.11 27.77 6.61 8.96 5.59 1.87 4.88 24.19 15.46 18.97 5.72 8.28 2.70 0.74 3.70 36.83 16.45 20.29 7.34 9.57 4.29 1.66 2.33 The table shows the annual compensation of 40 randomly chosen CEOs (millions of dollars). 4.91 1.79 23.00 7.34 13.40 5.22 2.22 4.94 193.74 16.26 24.98 8.68 10.19 16.34 2.59 3.62 86.09 13.11 27.77 6.61 8.96 5.59 1.87 4.88 24.19 15.46 18.97 5.72 8.28 2.70 0.74 3.70 36.83 16.45 20.29 7.34 9.57 4.29 1.66 2.33 (c) Identify any unusual values. (Round your answers to 2 decimal places.) ______________ million ______________ millionThe annual salary for a sample of U.S. governors in 2017 are as follows: $120395, $177467, $130273, $139339, $177412, $99636, $150000, $159300, $123427, $108167, $149730, $110834, $105000, $142265, $148886, $98600, $106078, $109470, $160135, $175000, $150000, $105000. 1. Find the mean and the standard deviation for the sample of annual salaries. 2. What is the associated t - score for a 99% confidence level? 3. What is the margin of error for a confidence level of 99%? 4. Find a 99% confidence interval for the mean salary of U.S. governors in 2017. Assume the data is normally distributed.Construct a frequncy distribution using 5 classes. 4, 16 13 0 5 20 23 23 6 29 20 0 13 27 29 5 5 18 4 7
- a) What proportion of 20% of defective items should a supervisor in the quality system of a plastic products company accept when they ask him to evaluate a routine inspection procedure for orders of 100 identical articles, knowing that the procedure consists of taking a sample of 10 items and the one to accept the order if no more than 2 defective items are found? b) How many defective items are expected to appear in the sample?Suppose you are a researcher and you are interested in determine the consumption behavior of all first year students at Mzumbe University. Due to limited resources you decide to select only 500 students to represent the entire group. Use the stratified sampling with probability proportional to size to identify the number of students from each programme that will be included in the sample. Assume that the total number of students in each degree programme is as indicated in the table below; Course Econ BAF HRM Education Computer No of students 500 800 1000 400 200 Source: Hypothetical dataThe control department of a light bulb manufacturer randomly picks 4400 light bulbs from the production lot every week. The records show that, when there is no malfunction, the defect rate in the manufacturing process ( due to imperfections in the material used) is 1%. When 1.25% or more of the light bulbs in the sample of 4400 are defective, the control unit calls repair technicians for service. Answer the following.
- Suppose that a single-sampling plan with n=50 and c=1 is being used for receiving inspection where the supplier ships the product in lots of size N=3,000, If the lot fraction defective is p = 0.02. Determine the probability of rejecting the lot.A company has established a sampling plan where it has defined that its sample size is 80 with an acceptance value of 2. With this information, establish the probability of acceptance for the following values of defective products (1%, 3% and 5% ). Determine the probabilities of acceptance for those same defective portions if the sample is increased to 120 and 170 units. a. What is the Probability of Acceptance for n=80, c=2 and p=0.01? b. What is the Probability of Acceptance for n=80, c=2 and p=0.03? c. What is the Probability of Acceptance for n=80, c=2 and p=0.05? d. What is the Probability of Acceptance for n=120, c=2 and p=0.01? e. What is the Probability of Acceptance for n=120, c=2 and p=0.03? F. What is the Probability of Acceptance for n=120, c=2 and p=0.05? g. What is the Probability of Acceptance for n=170, c=2 and p=0.01? h. What is the Probability of Acceptance for n=170, c=2 and p=0.03? I. What is the Probability of Acceptance for n=170, c=2 and p=0.05? J. Which plan…