Randy Harris, controller, has been given the charge to implement an advanced cost management system. As part of this process, he needs to identify activity drivers for the activities of the firm. During the past four months, Randy has spent considerable effort identifying activities, their associated costs, and possible drivers for the activities' costs. Initially, Randy made his selections based on his own judgment using his experience and input from employees who perform the activities. Later, he used regression analysis to confirm his judgment. Randy prefers to use one driver per activity, provided that an R2 of at least 80 percent can be produced. Otherwise, multiple drivers will be used, based on evidence provided by multiple regression analysis. For example, the activity of inspecting finished goods produced an R2 of less than 80 percent for any single activity driver. Randy believes, however, that a satisfactory cost formula can be developed using two activity drivers: the number of batches and the number of inspection hours. Data collected for a 14-month period are as follows: Inspection Costs Hours of Inspection Num


Correlation
Correlation defines a relationship between two independent variables. It tells the degree to which variables move in relation to each other. When two sets of data are related to each other, there is a correlation between them.
Linear Correlation
A correlation is used to determine the relationships between numerical and categorical variables. In other words, it is an indicator of how things are connected to one another. The correlation analysis is the study of how variables are related.
Regression Analysis
Regression analysis is a statistical method in which it estimates the relationship between a dependent variable and one or more independent variable. In simple terms dependent variable is called as outcome variable and independent variable is called as predictors. Regression analysis is one of the methods to find the trends in data. The independent variable used in Regression analysis is named Predictor variable. It offers data of an associated dependent variable regarding a particular outcome.
Multiple Regression, Confidence Intervals, Reliability of Cost Formulas
Randy Harris, controller, has been given the charge to implement an advanced cost management system. As part of this process, he needs to identify activity drivers for the activities of the firm. During the past four months, Randy has spent considerable effort identifying activities, their associated costs, and possible drivers for the activities' costs.
Initially, Randy made his selections based on his own judgment using his experience and input from employees who perform the activities. Later, he used
| Inspection Costs | Hours of Inspection | Number of Batches | ||
| $17,689 | 100 | 10 | ||
| 18,350 | 120 | 20 | ||
| 13,125 | 60 | 15 | ||
| 28,000 | 320 | 30 | ||
| 30,560 | 240 | 25 | ||
| 31,755 | 200 | 40 | ||
| 40,750 | 280 | 35 | ||
| 29,500 | 230 | 22 | ||
| 47,570 | 350 | 50 | ||
| 36,740 | 270 | 45 | ||
| 43,500 | 350 | 38 | ||
| 26,780 | 200 | 18 | ||
| 28,500 | 140 | 28 | ||
| 17,000 | 160 | 14 |
Required:
1. Calculate the cost formula for inspection costs using the two drivers, inspection hours and number of batches. In the formula, round your answer for the intercept to the nearest whole number and round the X variables 1 and 2 to the nearest cent. Where X1 = hours of inspection, and X2 = number of batches.
Y = $ 5289 + $ 55.82 X1 + $428.69 X2
Are both activity drivers useful?
Yes
What is the adjusted R2? Round to the nearest whole percent.
87%
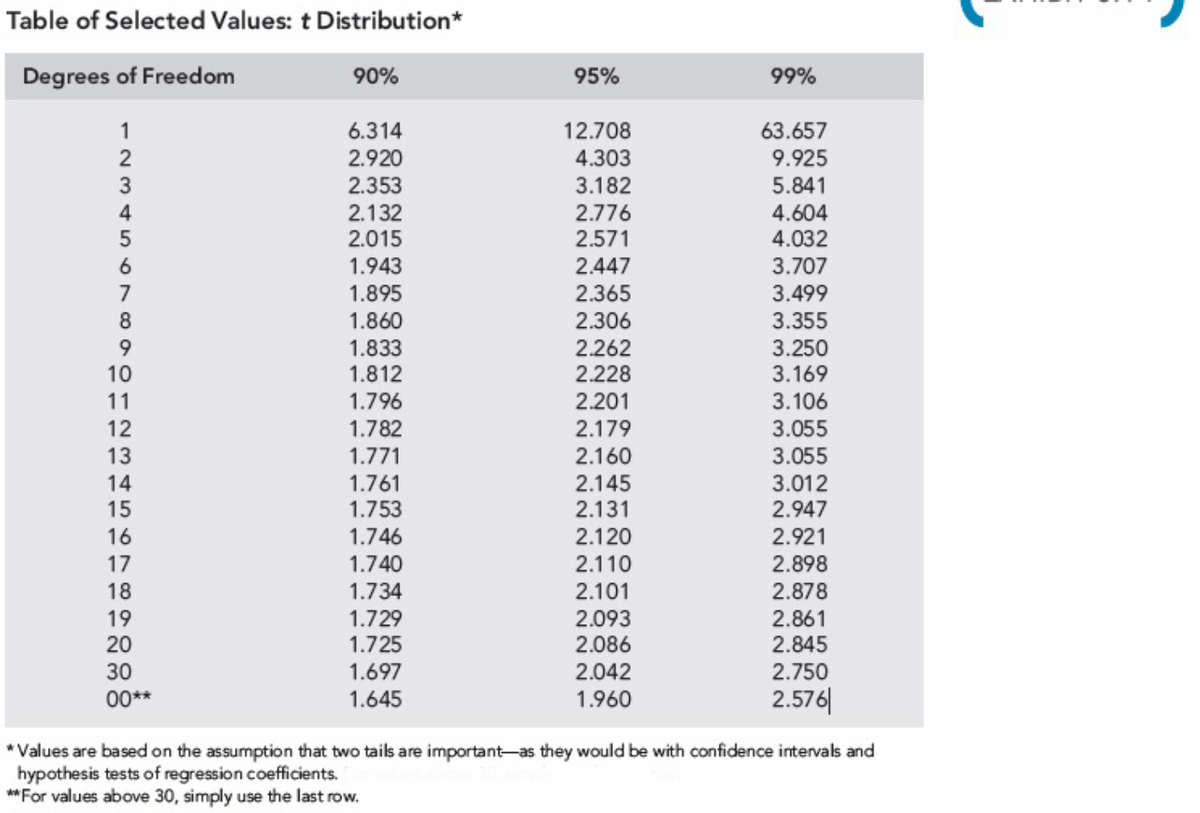
2. Using the formula developed in Requirement 1, calculate the inspection cost when 300 inspection hours are used and 30 batches are produced. Prepare a 90 percent confidence interval for this prediction. (Refer to Exhibit 3.14). In your computations, round X1 and X2 to 2 decimals, round intercept, Yf and the standard error to the nearest dollar and round t-values to three decimals. Enter the final answers rounded to the nearest dollar.
Y = $ 34896
$ ≤ Yf ≤ $


Trending now
This is a popular solution!

Step by step
Solved in 4 steps with 4 images


