Rank the decision alternatives on the basis of expected value and on the basis of expected utility.
Rank the decision alternatives on the basis of expected value and on the basis of expected utility.

College Algebra
7th Edition
ISBN:9781305115545
Author:James Stewart, Lothar Redlin, Saleem Watson
Publisher:James Stewart, Lothar Redlin, Saleem Watson
Chapter9: Counting And Probability
Section9.4: Expected Value
Problem 1E: If a game gives payoffs of $10 and $100 with probabilities 0.9 and 0.1, respectively, then the...

Related questions
Question
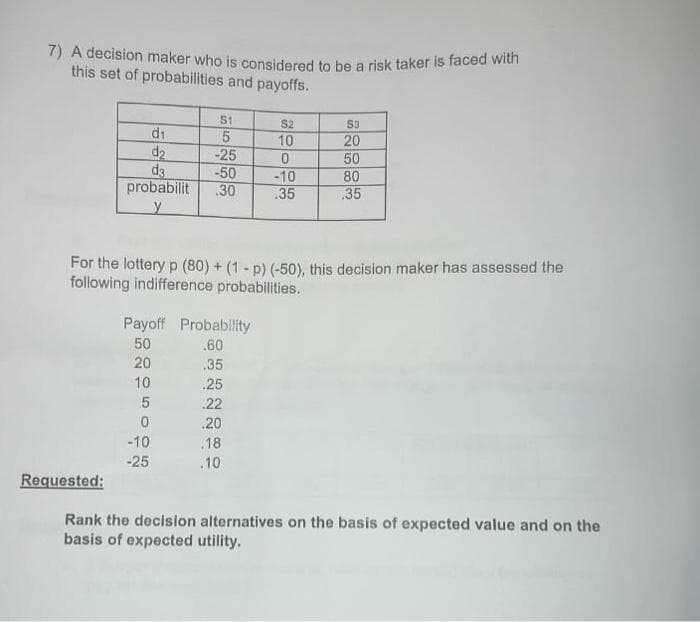
Transcribed Image Text:7) A decision maker who is considered to be a risk taker is faced with
this set of probabilities and payoffs.
d₁
d₂
d3
probabilit
y
Requested:
55253
-50
-10
-25
.30
Payoff Probability
50
.60
20
10
5
0
S2
10
For the lottery p (80) + (1 - p) (-50), this decision maker has assessed the
following indifference probabilities.
35
25
.22
.20
.18
.10
0
-10
.35
S3
20
50
80
.35
Rank the decision alternatives on the basis of expected value and on the
basis of expected utility.
Expert Solution
This question has been solved!
Explore an expertly crafted, step-by-step solution for a thorough understanding of key concepts.

Step by step
Solved in 4 steps

Recommended textbooks for you
College Algebra
Algebra
ISBN:
9781305115545
Author:
James Stewart, Lothar Redlin, Saleem Watson
Publisher:
Cengage Learning
College Algebra
Algebra
ISBN:
9781305115545
Author:
James Stewart, Lothar Redlin, Saleem Watson
Publisher:
Cengage Learning