re of 11 girls and 16 boys, all of whom were 16 years of age. Girls Boys 23.0 31.0 25.5 26.5 26.0 27.5 26.5 27.0 23.5 26.0 22.5 28.5 25.0 26.5 24.0 25.5 21.5 26.0 19.5 31.5 28.0 25.0 28.0 29.5 26.0 30.0 25.0
re of 11 girls and 16 boys, all of whom were 16 years of age. Girls Boys 23.0 31.0 25.5 26.5 26.0 27.5 26.5 27.0 23.5 26.0 22.5 28.5 25.0 26.5 24.0 25.5 21.5 26.0 19.5 31.5 28.0 25.0 28.0 29.5 26.0 30.0 25.0

Glencoe Algebra 1, Student Edition, 9780079039897, 0079039898, 2018
18th Edition
ISBN:9780079039897
Author:Carter
Publisher:Carter
Chapter10: Statistics
Section10.3: Measures Of Spread
Problem 1GP

Related questions
Question
- The following data are on the dental measurements (distance in mm from the center of the pituitary to the pterygomaxillary fissure of 11 girls and 16 boys, all of whom were 16 years of age.
|
Girls |
Boys |
|
23.0 |
31.0 |
|
25.5 |
26.5 |
|
26.0 |
27.5 |
|
26.5 |
27.0 |
|
23.5 |
26.0 |
|
22.5 |
28.5 |
|
25.0 |
26.5 |
|
24.0 |
25.5 |
|
21.5 |
26.0 |
|
19.5 |
31.5 |
|
28.0 |
25.0 |
|
|
28.0 |
|
|
29.5 |
|
|
26.0 |
|
|
30.0 |
|
|
25.0 |
A. From the output, what is the standard error for the average difference in dental measurements in the population of 16 year old boy and 16 year old girls (assume the population variances are equal)
B. From the output, interpret the 95% confidence interval for the true average difference in dental measurements
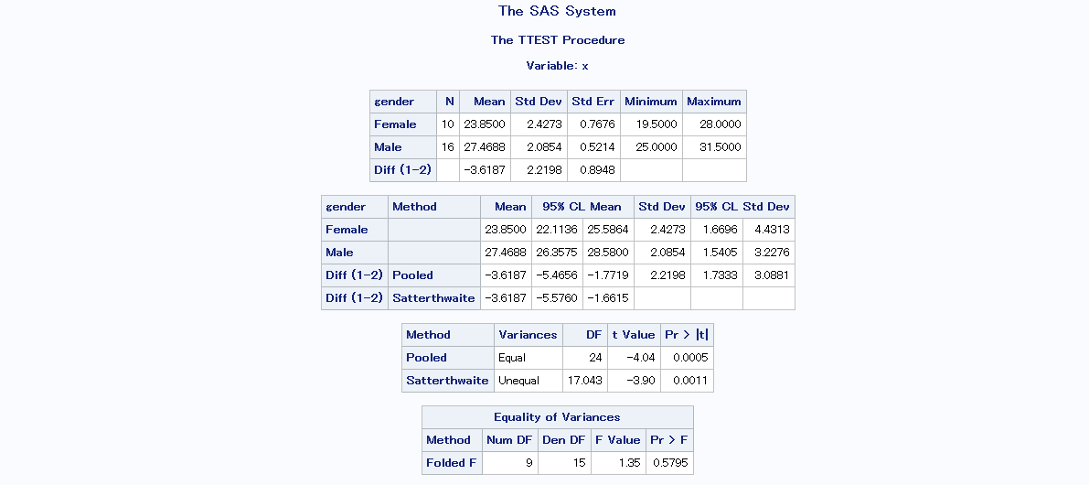
Transcribed Image Text:The SAS System
The TTEST Procedure
Variable: x
N Mean
10 23.8500
16 27.4688
Std Dev Std Err Minimum Maximum
2.4273 0.7676 19.5000 28.0000
2.0854 0.5214 25.0000 31.5000
-3.6187 2.2198 0.8948
gender
Method
Female
Mean 95% CL Mean
23.8500 22.1136 25.5864
27.4688 26.3575 28.5800
-3.6187 -5.4656 -1.7719
Male
Diff (1-2) Pooled
Diff (1-2) Satterthwaite -3.6187 -5.5760 -1.6615
DF t Value Pr > |t|
Method
Pooled
Variances
Equal
Satterthwaite Unequal 17.043
24 -4.04 0.0005
-3.90 0.0011
Equality of Variances
Method Num DF Den DF F Value Pr > F
Folded F
9
15
1.35 0.5795
gender
Female
Male
Diff (1-2)
Std Dev 95% CL Std Dev
2.4273 1.6696 4.4313
2.0854 1.5405 3.2276
2.2198 1.7333 3.0881
Expert Solution
This question has been solved!
Explore an expertly crafted, step-by-step solution for a thorough understanding of key concepts.

Step by step
Solved in 3 steps

Recommended textbooks for you
Glencoe Algebra 1, Student Edition, 9780079039897…
Algebra
ISBN:
9780079039897
Author:
Carter
Publisher:
McGraw Hill
Glencoe Algebra 1, Student Edition, 9780079039897…
Algebra
ISBN:
9780079039897
Author:
Carter
Publisher:
McGraw Hill