The mean yield from process A is estimated to be 80 ± 5, where the units are percent of a theoretical maximum. The mean yield from process B is estimated to be 90 ± 3. The relative increase obtained from process B is therefore estimated to be (90 − 80)/80 = 0.125. Find the uncertainty in this estimate.

MATLAB: An Introduction with Applications
6th Edition
ISBN:9781119256830
Author:Amos Gilat
Publisher:Amos Gilat
Chapter1: Starting With Matlab
Section: Chapter Questions
Problem 1P
icon
Related questions
Question

The mean yield from process A is estimated to be 80 ± 5, where the units are percent of a theoretical maximum. The mean yield from process B is estimated to be 90 ± 3. The relative increase obtained from process B is therefore estimated to be (90 − 80)/80 = 0.125. Find the uncertainty in this estimate.

Expert Solution
Step 1

The mean yield from process A is estimated to be A= 80±5 and the mean yield from process B is estimated to be B= 90±3.

The form of the measurements of a process is,

Measured value(μ)± Standard deviation(σ).

Here, for a random sample the measured value will be sample mean and the population standard deviation will be sample standard deviation.

The form of the measurements of mean yield from process A is A= 80±5.

Here, the measured value of mean yield from process A is A= 80 and the uncertainty in the mean yield from process A is σA=5.

The form of the measurements of mean yield from process B is B= 90±3

Here, the measured value of mean yield from process B is B= 90 and the uncertainty in the mean yield from process B is σB=3.

Step 2

Uncertainty:

The uncertainty of a process is determined by the standard deviation of the measurements. In other words, it can be said that the measure of the variability of a process is known as the uncertainty of the process.

Therefore, it can be said that uncertainty is simply (σ).

Standard deviation:

The standard deviation is based on how much each observation deviates from a central point represented by the mean. In general, the greater the distances between the individual observations and the mean, the greater the variability of the data set.

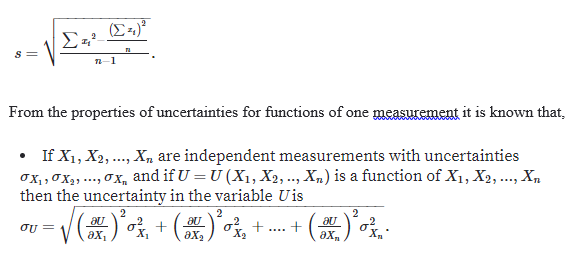
The general formula for standard deviation is,

Statistics homework question answer, step 2, image 1

steps

Step by step

Solved in 3 steps with 2 images

Blurred answer
Knowledge Booster
Statistical Quality Control
Learn more about
Need a deep-dive on the concept behind this application? Look no further. Learn more about this topic, statistics and related others by exploring similar questions and additional content below.
Similar questions
  • SEE MORE QUESTIONS
Recommended textbooks for you
MATLAB: An Introduction with Applications
Statistics
ISBN:
9781119256830
Author:
Amos Gilat
Publisher:
John Wiley & Sons Inc
Probability and Statistics for Engineering and th…
Statistics
ISBN:
9781305251809
Author:
Jay L. Devore
Publisher:
Cengage Learning
Statistics for The Behavioral Sciences (MindTap C…
Statistics
ISBN:
9781305504912
Author:
Frederick J Gravetter, Larry B. Wallnau
Publisher:
Cengage Learning
Elementary Statistics: Picturing the World (7th E…
Statistics
ISBN:
9780134683416
Author:
Ron Larson, Betsy Farber
Publisher:
PEARSON
The Basic Practice of Statistics
Statistics
ISBN:
9781319042578
Author:
David S. Moore, William I. Notz, Michael A. Fligner
Publisher:
W. H. Freeman
Introduction to the Practice of Statistics
Statistics
ISBN:
9781319013387
Author:
David S. Moore, George P. McCabe, Bruce A. Craig
Publisher:
W. H. Freeman