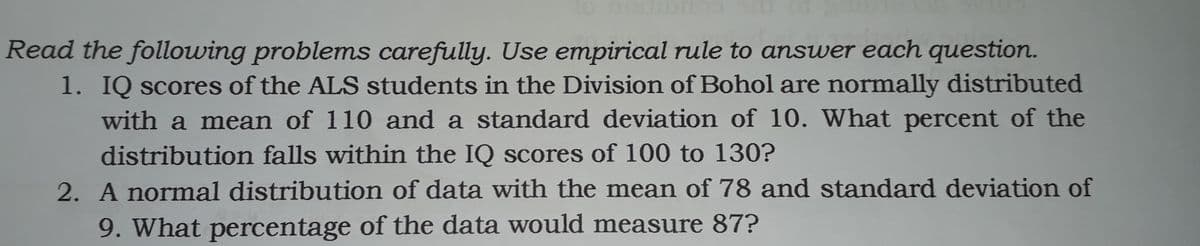
Read the following problems carefully. Use empirical rule to answer each question. 1. IQ scores of the ALS students in the Division of Bohol are normally distributed with a mean of 110 and a standard deviation of 10. What percent of the distribution falls within the IQ scores of 100 to 130? 2. A normal distribution of data with the mean of 78 and standard deviation of 9. What percentage of the data would measure 87?
Read the following problems carefully. Use empirical rule to answer each question. 1. IQ scores of the ALS students in the Division of Bohol are normally distributed with a mean of 110 and a standard deviation of 10. What percent of the distribution falls within the IQ scores of 100 to 130? 2. A normal distribution of data with the mean of 78 and standard deviation of 9. What percentage of the data would measure 87?

Glencoe Algebra 1, Student Edition, 9780079039897, 0079039898, 2018
18th Edition
ISBN:9780079039897
Author:Carter
Publisher:Carter
Chapter10: Statistics
Section10.3: Measures Of Spread
Problem 23PFA

Related questions
Topic Video
Question
Kindly answer items 1 and 2. Kindly refer to the
Transcribed Image Text:Read the following problems carefully. Use empirical rule to answer each question.
1. IQ scores of the ALS students in the Division of Bohol are normally distributed
with a mean of 110 and a standard deviation of 10. What percent of the
distribution falls within the IQ scores of 100 to 130?
2. A normal distribution of data with the mean of 78 and standard deviation of
9. What percentage of the data would measure 87?
Transcribed Image Text:EMPIRICAL RULE
99.7%
95%
68%
I 2.35% 1 13.5% I 34%
34%
13.5%
2.35% I
-1
1.
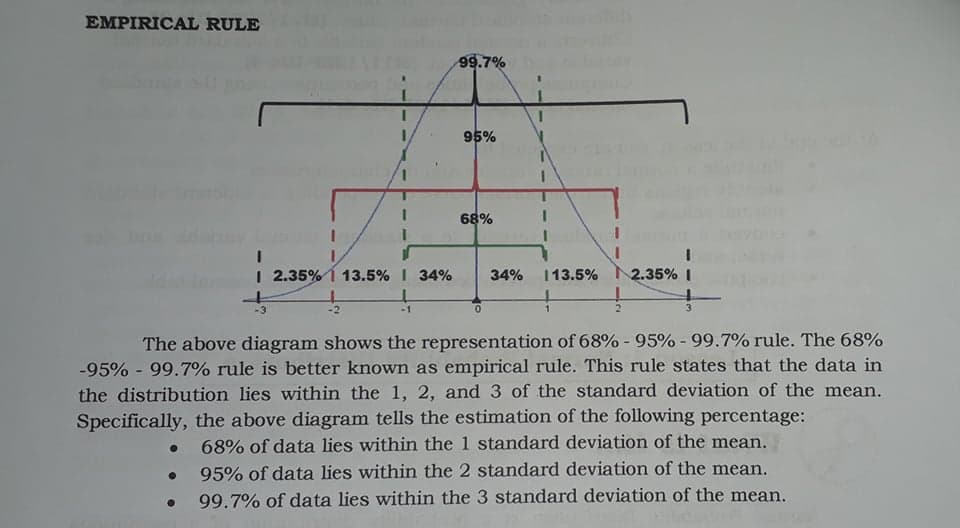
The above diagram shows the representation of 68% - 95% - 99.7% rule. The 68%
-95% - 99.7% rule is better known as empirical rule. This rule states that the data in
the distribution lies within the 1, 2, and 3 of the standard deviation of the mean.
Specifically, the above diagram tells the estimation of the following percentage:
68% of data lies within the 1 standard deviation of the mean.
95% of data lies within the 2 standard deviation of the mean.
99.7% of data lies within the 3 standard deviation of the mean.
Expert Solution
This question has been solved!
Explore an expertly crafted, step-by-step solution for a thorough understanding of key concepts.

This is a popular solution!

Trending now
This is a popular solution!

Step by step
Solved in 4 steps

Knowledge Booster


Learn more about
Need a deep-dive on the concept behind this application? Look no further. Learn more about this topic, statistics and related others by exploring similar questions and additional content below.Recommended textbooks for you
Glencoe Algebra 1, Student Edition, 9780079039897…
Algebra
ISBN:
9780079039897
Author:
Carter
Publisher:
McGraw Hill
Glencoe Algebra 1, Student Edition, 9780079039897…
Algebra
ISBN:
9780079039897
Author:
Carter
Publisher:
McGraw Hill