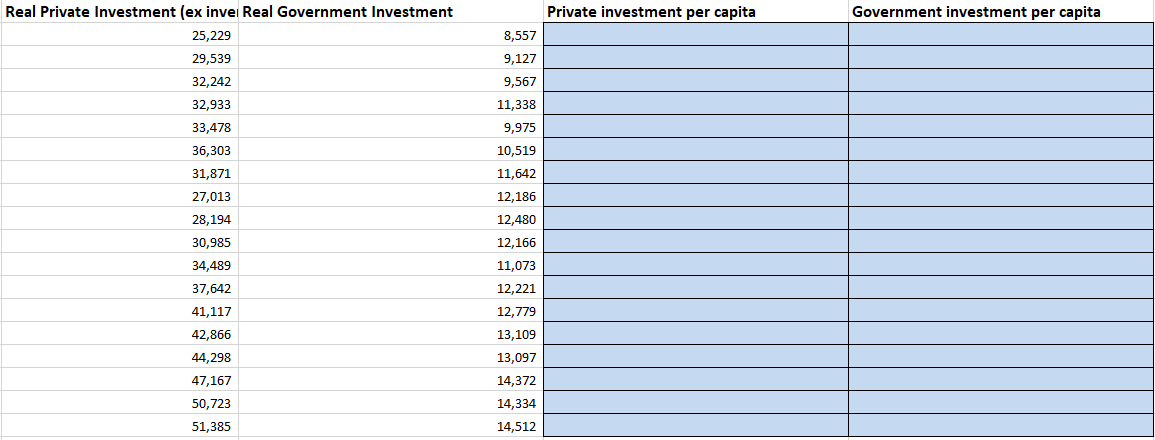
Real Private Investment (ex invei Real Government Investment Private investment per capita Government investment per capita 25,229 8,557 29,539 9,127 32,242 9,567 32,933 11,338 33,478 9,975 36,303 10,519 31,871 11,642 27,013 12,186 28,194 12,480 30,985 12,166 34,489 11,073 37,642 12,221 41,117 12,779 42,866 13,109 44,298 13,097 47,167 14,372 50,723 14,334 51,385 14,512
Real Private Investment (ex invei Real Government Investment Private investment per capita Government investment per capita 25,229 8,557 29,539 9,127 32,242 9,567 32,933 11,338 33,478 9,975 36,303 10,519 31,871 11,642 27,013 12,186 28,194 12,480 30,985 12,166 34,489 11,073 37,642 12,221 41,117 12,779 42,866 13,109 44,298 13,097 47,167 14,372 50,723 14,334 51,385 14,512

Chapter6: Tracking The U.s. Economy
Section: Chapter Questions
Problem 3.6P

Related questions
Question
Calculate government investment per capita for each year
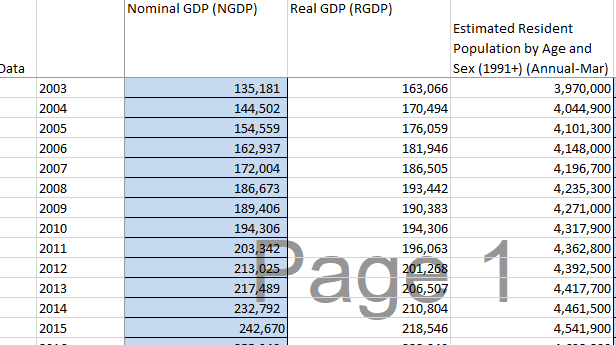
Transcribed Image Text:Nominal GDP (NGDP)
Real GDP (RGDP)
Estimated Resident
Population by Age and
Sex (1991+) (Annual-Mar)
Data
2003
163,066
135,181
144,502
3,970,000
4,044,900
4,101,300
4,148,000
4,196,700
4,235,300
4,271,000
4,317,900
4,362,800
4,392,500
2004
170,494
2005
154,559
176,059
2006
162,937
181,946
2007
172,004
186,505
2008
186,673
193,442
2009
189,406
190,383
2010
194,306
194,306
2011
203,342
Page 1
196,063
201,268
206,507
210,804
2012
213,025
2013
217,489
4,417,700
4,461,500
4,541,900
2014
232,792
2015
242,670
218,546
Transcribed Image Text:Real Private Investment (ex invei Real Government Investment
Private investment per capita
Government investment per capita
25,229
8,557
29,539
9,127
32,242
9,567
32,933
11,338
33,478
9,975
36,303
10,519
31,871
11,642
27,013
12,186
28,194
12,480
30,985
12,166
34,489
11,073
37,642
12,221
41,117
12,779
42,866
13,109
44,298
13,097
47,167
14,372
50,723
14,334
51,385
14,512
Expert Solution
This question has been solved!
Explore an expertly crafted, step-by-step solution for a thorough understanding of key concepts.

Step by step
Solved in 2 steps

Knowledge Booster


Learn more about
Need a deep-dive on the concept behind this application? Look no further. Learn more about this topic, economics and related others by exploring similar questions and additional content below.Recommended textbooks for you


