recent survey identified the top accounting firms within 10 geographical regions across country X. The top 2 regions reported a combined growth of 19% and 18%. A characteristic description of the accounting firms in these two regions included the number of partners in the firms. Attached below is a sample of the number of partners for 20 firms for each region. Complete (a) through (c) below. a. At the 0.05 level of significance when pooling the variances, is there evidence of a difference between the two regions' accounting firms with respect to the mean number of partners? b. Determine the test statistic. c. Determine the critical value(s) and p-value
recent survey identified the top accounting firms within 10 geographical regions across country X. The top 2 regions reported a combined growth of 19% and 18%. A characteristic description of the accounting firms in these two regions included the number of partners in the firms. Attached below is a sample of the number of partners for 20 firms for each region. Complete (a) through (c) below. a. At the 0.05 level of significance when pooling the variances, is there evidence of a difference between the two regions' accounting firms with respect to the mean number of partners? b. Determine the test statistic. c. Determine the critical value(s) and p-value

Linear Algebra: A Modern Introduction
4th Edition
ISBN:9781285463247
Author:David Poole
Publisher:David Poole
Chapter7: Distance And Approximation
Section7.3: Least Squares Approximation
Problem 29EQ

Related questions
Topic Video
Question
A recent survey identified the top accounting firms within 10 geographical regions across country X. The top 2 regions reported a combined growth of 19% and 18%. A characteristic description of the accounting firms in these two regions included the number of partners in the firms. Attached below is a sample of the number of partners for 20 firms for each region. Complete (a) through (c) below.
a. At the 0.05 level of significance when pooling the variances, is there evidence of a difference between the two regions' accounting firms with respect to the mean number of partners?
b. Determine the test statistic.
c. Determine the critical value(s) and p-value
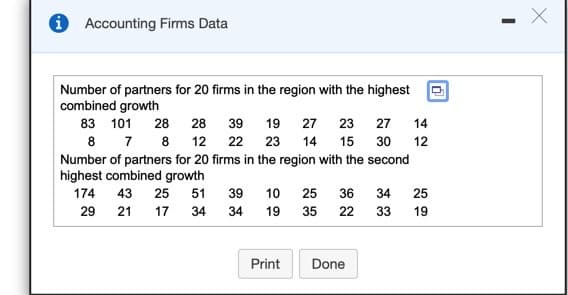
Transcribed Image Text:1 Accounting Firms Data
Number of partners for 20 firms in the region with the highest
combined growth
83 101
28 28 39 19 27 23 27
14
8 7
8
12 22
23
14
15
30
12
Number of partners for 20 firms in the region with the second
highest combined growth
174
43
25
51
39
10
25
36
34
25
29
21 17
34
34
19
35
22
33
19
Print
Done
Expert Solution
Step 1
Given,
| Highest combined growth(X) | Second highest growth(Y) |
| 83 | 174 |
| 101 | 43 |
| 28 | 25 |
| 28 | 51 |
| 39 | 39 |
| 19 | 10 |
| 27 | 25 |
| 23 | 36 |
| 27 | 34 |
| 14 | 25 |
| 8 | 29 |
| 7 | 21 |
| 8 | 17 |
| 12 | 34 |
| 22 | 34 |
| 23 | 19 |
| 14 | 35 |
| 15 | 22 |
| 30 | 33 |
| 12 | 19 |

Trending now
This is a popular solution!

Step by step
Solved in 2 steps

Knowledge Booster


Learn more about
Need a deep-dive on the concept behind this application? Look no further. Learn more about this topic, statistics and related others by exploring similar questions and additional content below.Recommended textbooks for you
Linear Algebra: A Modern Introduction
Algebra
ISBN:
9781285463247
Author:
David Poole
Publisher:
Cengage Learning
Linear Algebra: A Modern Introduction
Algebra
ISBN:
9781285463247
Author:
David Poole
Publisher:
Cengage Learning