Recreational Time A researcher wishes to see if there is a difference between the mean number of hours per week that a family with no children participates in recreational activities and a family with children participates in recreational activities. She selects two random samples and the data are shown. Use u, for the mean number of families with no children. At a = 0.05, is there a difference between the means? Use the critical value method and tables. X No children 8.8 2.5 35 Children 10.1 2.9 35 Send data to Excel Part: 0 / 5 Part 1 of 5 (a) State the hypotheses and identify the claim. Ho: |(Choose one) ▼ H : (Choose one) ▼ This hypothesis test is a (Choose one) ▼ test.
Recreational Time A researcher wishes to see if there is a difference between the mean number of hours per week that a family with no children participates in recreational activities and a family with children participates in recreational activities. She selects two random samples and the data are shown. Use u, for the mean number of families with no children. At a = 0.05, is there a difference between the means? Use the critical value method and tables. X No children 8.8 2.5 35 Children 10.1 2.9 35 Send data to Excel Part: 0 / 5 Part 1 of 5 (a) State the hypotheses and identify the claim. Ho: |(Choose one) ▼ H : (Choose one) ▼ This hypothesis test is a (Choose one) ▼ test.

MATLAB: An Introduction with Applications
6th Edition
ISBN:9781119256830
Author:Amos Gilat
Publisher:Amos Gilat
Chapter1: Starting With Matlab
Section: Chapter Questions
Problem 1P

Related questions
Question
The first pic is the question. Since some tutors have been solving the problems wrong recently (no judgment), I’ve added a sample question to solve problem.
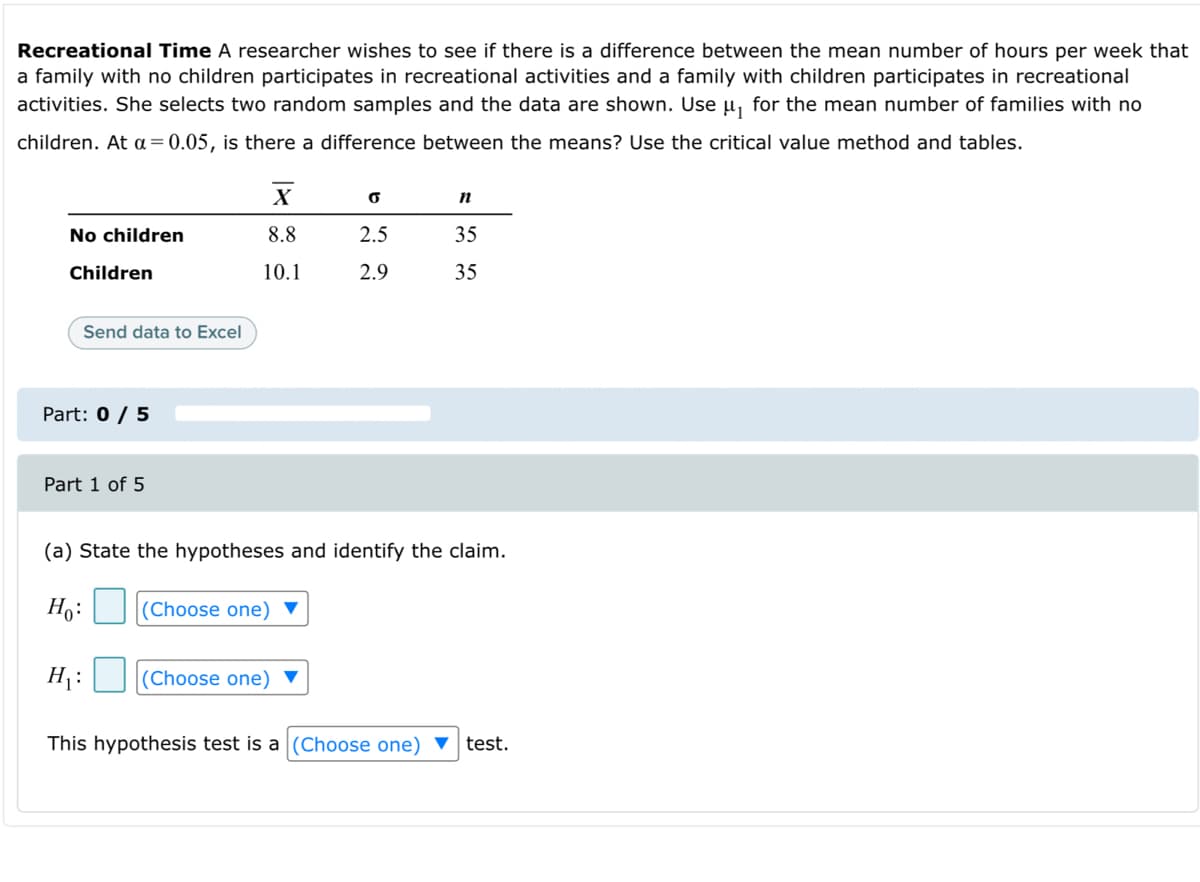
Transcribed Image Text:Recreational Time A researcher wishes to see if there is a difference between the mean number of hours per week that
a family with no children participates in recreational activities and a family with children participates in recreational
activities. She selects two random samples and the data are shown. Use u, for the mean number of families with no
children. At a = 0.05, is there a difference between the means? Use the critical value method and tables.
No children
8.8
2.5
35
Children
10.1
2.9
35
Send data to Excel
Part: 0 / 5
Part 1 of 5
(a) State the hypotheses and identify the claim.
Ho:
(Choose one) ▼
H:
|(Choose one) ▼
This hypothesis test is a (Choose one) v test.
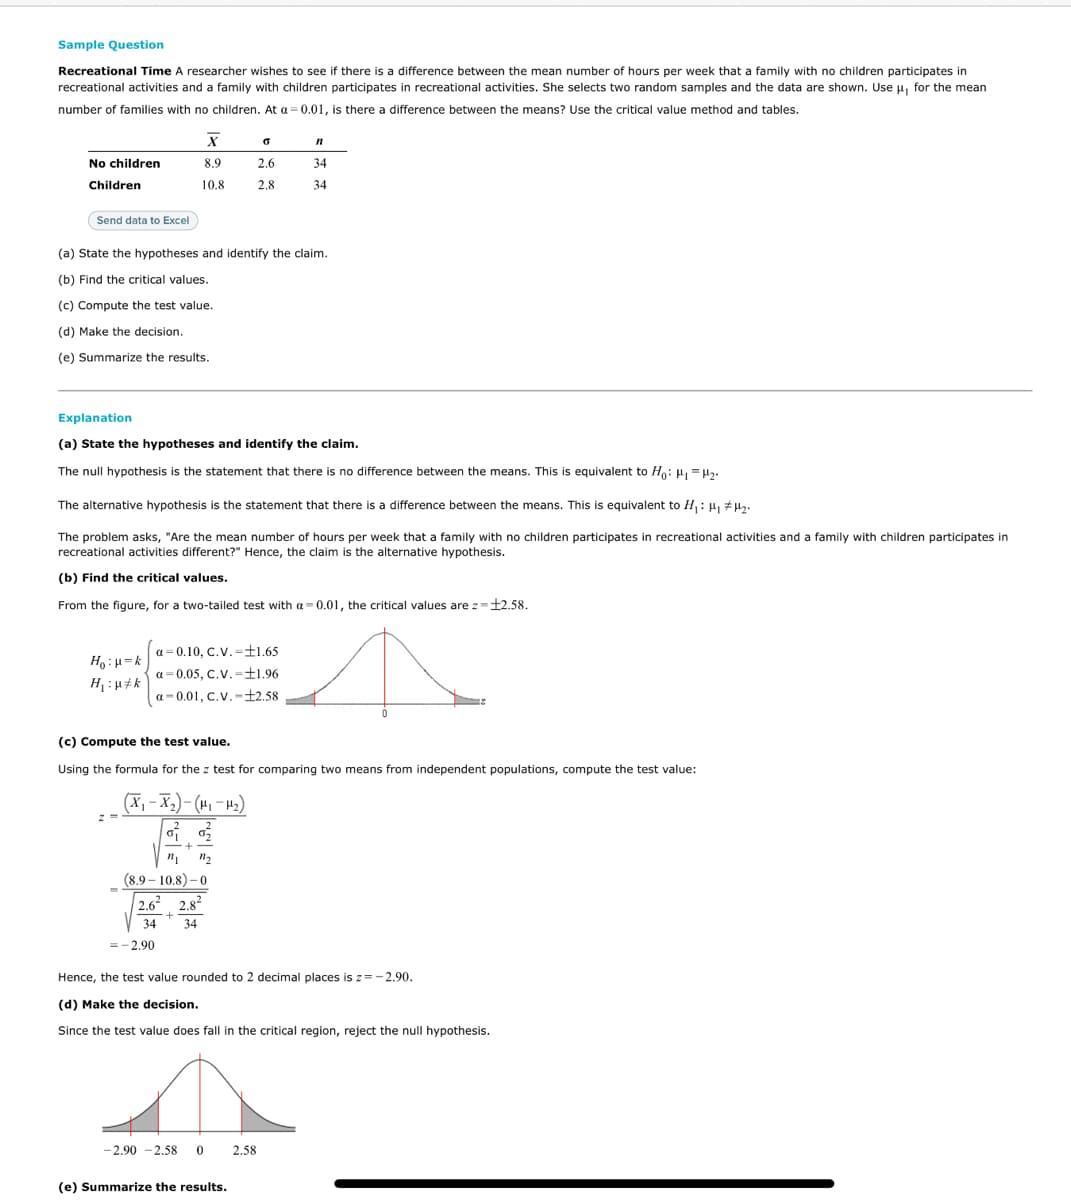
Transcribed Image Text:Sample Question
Recreational Time A researcher wishes to see if there is a difference between the mean number of hours per week that a family with no children participates in
recreational activities and a family with children participates in recreational activities. She selects two random samples and the data are shown. Use u, for the mean
number of families with no children. At a =0.01, is there a difference between the means? Use the critical value method and tables.
No children
8.9
2.6
34
Children
10.8
2.8
34
Send data to Excel
(a) State the hypotheses and identify the claim.
(b) Find the critical values.
(c) Compute the test value.
(d) Make the decision.
(e) Summarize the results.
Explanation
(a) State the hypotheses and identify the claim.
The null hypothesis is the statement that there is no difference between the means. This is equivalent to H: H, =H.
The alternative hypothesis is the statement that there is a difference between the means. This is equivalent to H,: H, #µy.
The problem asks, "Are the mean number of hours per week that a family with no children participates in recreational activities and a family with children participates in
recreational activities different?" Hence, the claim is the alternative hypothesis.
(b) Find the critical values.
From the figure, for a two-tailed test with a= 0.01, the critical values are z=12.58.
a= 0.10, C.V.=±1.65
¥ = ri : °H
a= 0.05, C.V.-±1.96
H :H#k
a- 0.01, C.V.-£2.58
(c) Compute the test value.
Using the formula for the z test for comparing two means from independent populations, compute the test value:
(X,- X2)- (H, – H2)
(8.9 – 10.8) – 0
2.62 2.82
34
34
=-2.90
Hence, the test value rounded to 2 decimal places is z= - 2.90.
(d) Make the decision.
Since the test value does fall in the critical region, reject the null hypothesis.
-2.90 -2.58
2.58
(e) Summarize the results.
Expert Solution
This question has been solved!
Explore an expertly crafted, step-by-step solution for a thorough understanding of key concepts.

This is a popular solution!

Trending now
This is a popular solution!

Step by step
Solved in 3 steps with 2 images

Recommended textbooks for you
MATLAB: An Introduction with Applications
Statistics
ISBN:
9781119256830
Author:
Amos Gilat
Publisher:
John Wiley & Sons Inc

Probability and Statistics for Engineering and th…
Statistics
ISBN:
9781305251809
Author:
Jay L. Devore
Publisher:
Cengage Learning

Statistics for The Behavioral Sciences (MindTap C…
Statistics
ISBN:
9781305504912
Author:
Frederick J Gravetter, Larry B. Wallnau
Publisher:
Cengage Learning
MATLAB: An Introduction with Applications
Statistics
ISBN:
9781119256830
Author:
Amos Gilat
Publisher:
John Wiley & Sons Inc
Probability and Statistics for Engineering and th…
Statistics
ISBN:
9781305251809
Author:
Jay L. Devore
Publisher:
Cengage Learning
Statistics for The Behavioral Sciences (MindTap C…
Statistics
ISBN:
9781305504912
Author:
Frederick J Gravetter, Larry B. Wallnau
Publisher:
Cengage Learning

Elementary Statistics: Picturing the World (7th E…
Statistics
ISBN:
9780134683416
Author:
Ron Larson, Betsy Farber
Publisher:
PEARSON

The Basic Practice of Statistics
Statistics
ISBN:
9781319042578
Author:
David S. Moore, William I. Notz, Michael A. Fligner
Publisher:
W. H. Freeman

Introduction to the Practice of Statistics
Statistics
ISBN:
9781319013387
Author:
David S. Moore, George P. McCabe, Bruce A. Craig
Publisher:
W. H. Freeman