red because we lin The data given to the right includes data from 44 candies, and 6 of them are red. The company that makes the candy claims that 30% of its candies are red. Use the sample data to construct a 90% confidence interval estimate of the percentage of red candies. What do you conclude about the claim of 30%? Weights (g) of a Sample Bag of Candy Red Blue Brown Green Yellow han... v 0.796 0.937 0.822 0.843 0.826 and Of Tooth 0.903 0.817 0.783 0.915 0.946 Construct a 90% confidence interval estimate of the population percentage of 0.998 0.954 0.956 0.924 0.954 lults Who Have Hea His Estimate.. o t candies that are red. 0.882 0.873 0.934 0.892 0.819 0.882 0.945 0.916 0.964 0.877 % fi..
red because we lin The data given to the right includes data from 44 candies, and 6 of them are red. The company that makes the candy claims that 30% of its candies are red. Use the sample data to construct a 90% confidence interval estimate of the percentage of red candies. What do you conclude about the claim of 30%? Weights (g) of a Sample Bag of Candy Red Blue Brown Green Yellow han... v 0.796 0.937 0.822 0.843 0.826 and Of Tooth 0.903 0.817 0.783 0.915 0.946 Construct a 90% confidence interval estimate of the population percentage of 0.998 0.954 0.956 0.924 0.954 lults Who Have Hea His Estimate.. o t candies that are red. 0.882 0.873 0.934 0.892 0.819 0.882 0.945 0.916 0.964 0.877 % fi..

College Algebra (MindTap Course List)
12th Edition
ISBN:9781305652231
Author:R. David Gustafson, Jeff Hughes
Publisher:R. David Gustafson, Jeff Hughes
Chapter8: Sequences, Series, And Probability
Section8.7: Probability
Problem 58E: What is meant by the sample space of an experiment?

Related questions

Concept explainers
Contingency Table
A contingency table can be defined as the visual representation of the relationship between two or more categorical variables that can be evaluated and registered. It is a categorical version of the scatterplot, which is used to investigate the linear relationship between two variables. A contingency table is indeed a type of frequency distribution table that displays two variables at the same time.
Binomial Distribution
Binomial is an algebraic expression of the sum or the difference of two terms. Before knowing about binomial distribution, we must know about the binomial theorem.
Topic Video
Question
7-1 #19
Transcribed Image Text:red because we lin
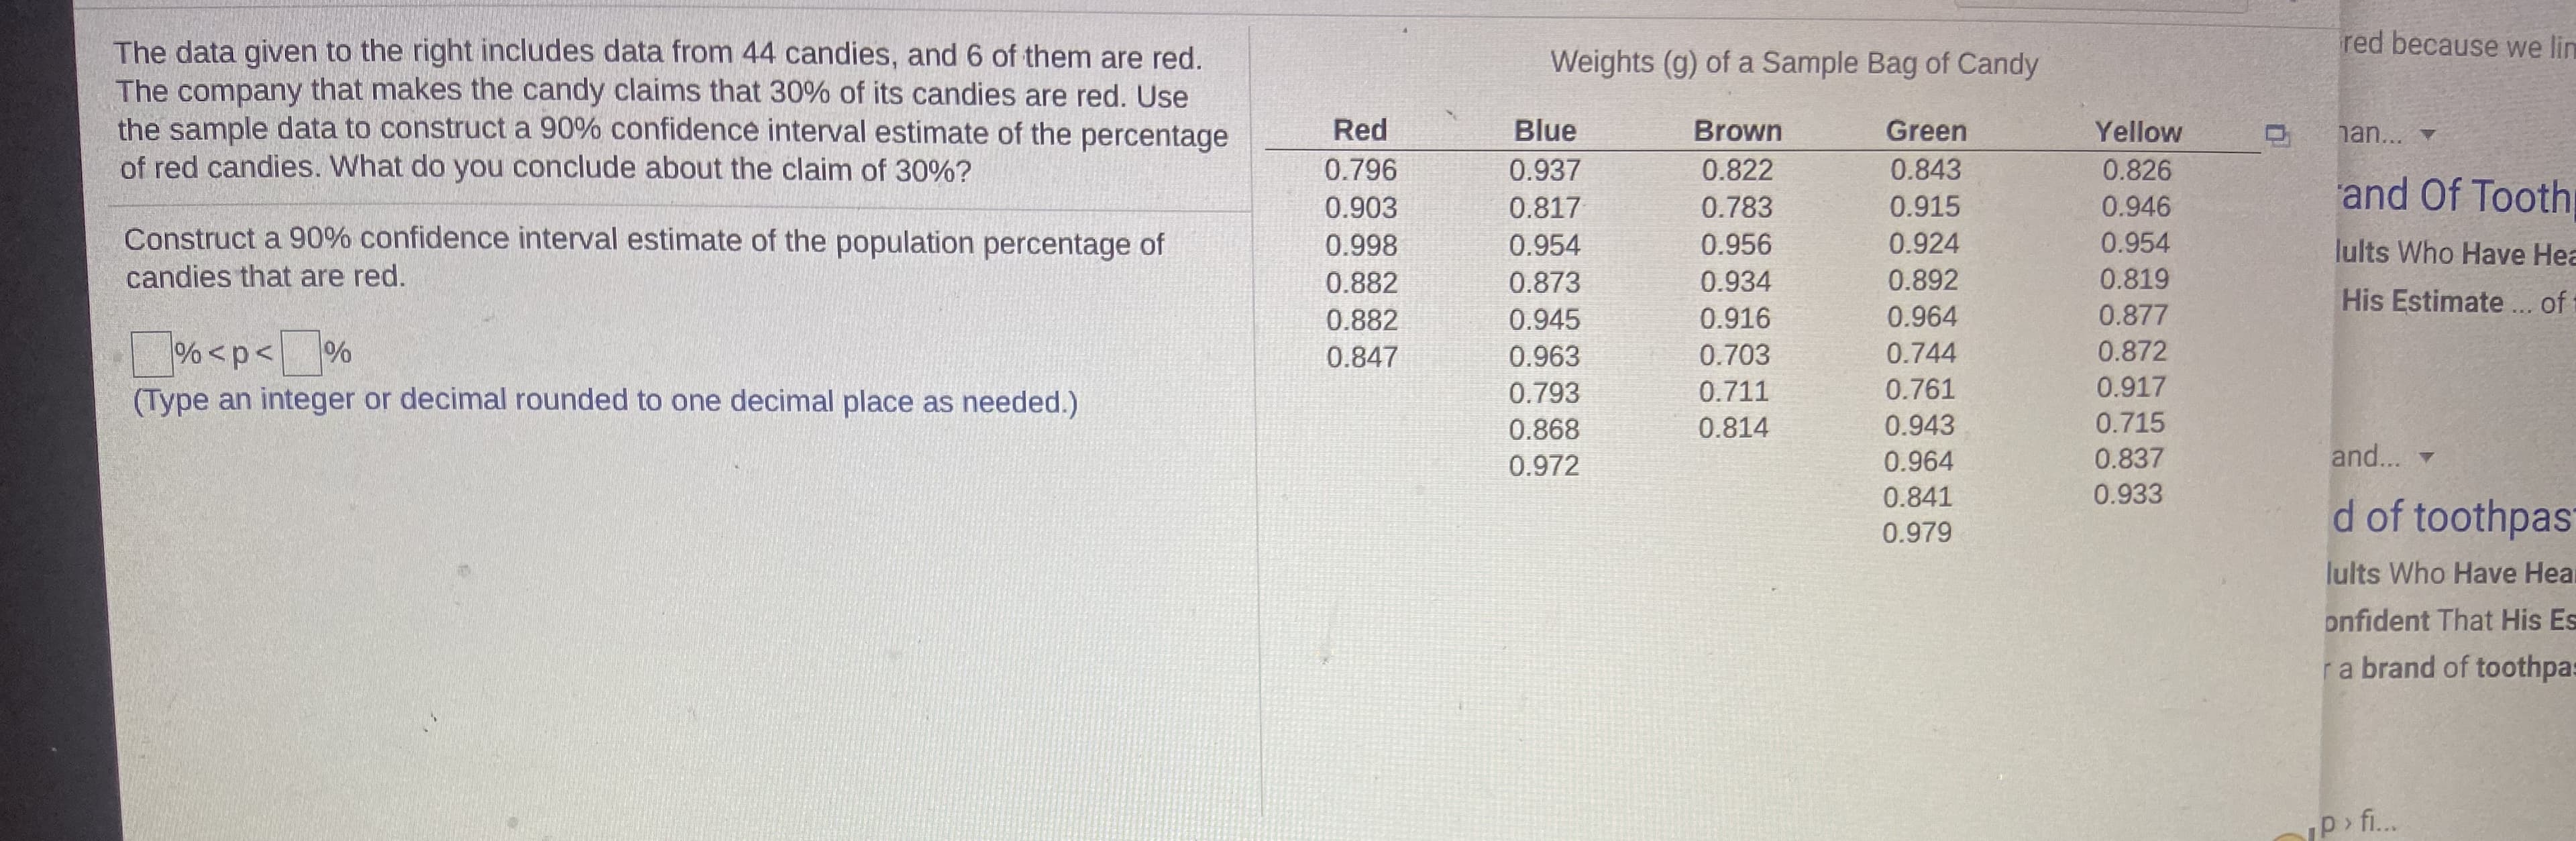
The data given to the right includes data from 44 candies, and 6 of them are red.
The company that makes the candy claims that 30% of its candies are red. Use
the sample data to construct a 90% confidence interval estimate of the percentage
of red candies. What do you conclude about the claim of 30%?
Weights (g) of a Sample Bag of Candy
Red
Blue
Brown
Green
Yellow
han... v
0.796
0.937
0.822
0.843
0.826
and Of Tooth
0.903
0.817
0.783
0.915
0.946
Construct a 90% confidence interval estimate of the population percentage of
0.998
0.954
0.956
0.924
0.954
lults Who Have Hea
His Estimate.. o t
candies that are red.
0.882
0.873
0.934
0.892
0.819
0.882
0.945
0.916
0.964
0.877
%<p< %
(Type an integer or decimal rounded to one decimal place as needed.)
0.847
0.963
0.703
0.744
0.872
0.793
0.711
0.761
0.917
0.868
0.814
0.943
0.715
0.972
0.964
0.837
and...
0.841
0.933
d of toothpast
0.979
lults Who Have Heal
onfident That His Es
ra brand of toothpas
p> fi..
Expert Solution
This question has been solved!
Explore an expertly crafted, step-by-step solution for a thorough understanding of key concepts.

This is a popular solution!

Trending now
This is a popular solution!

Step by step
Solved in 2 steps with 1 images

Knowledge Booster


Learn more about
Need a deep-dive on the concept behind this application? Look no further. Learn more about this topic, statistics and related others by exploring similar questions and additional content below.Recommended textbooks for you
College Algebra (MindTap Course List)
Algebra
ISBN:
9781305652231
Author:
R. David Gustafson, Jeff Hughes
Publisher:
Cengage Learning
College Algebra (MindTap Course List)
Algebra
ISBN:
9781305652231
Author:
R. David Gustafson, Jeff Hughes
Publisher:
Cengage Learning