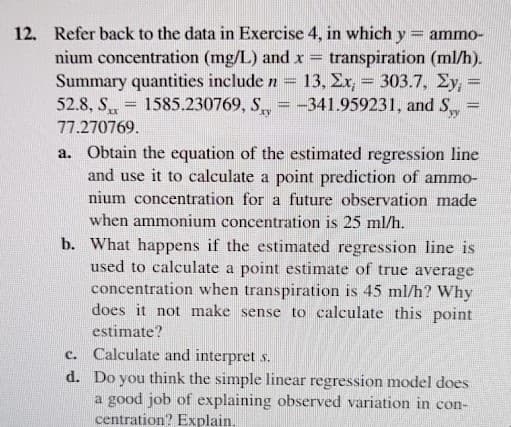
Refer back to the data in Exercise 4, in which y = ammo- nium concentration (mg/L) and x transpiration (ml/h). Summary quantities include n = 13, Ex, = 303.7, Ey, = 52.8, S = 1585.230769, S,, = -341.959231, and S, = %3D %3D yy 77.270769. a. Obtain the equation of the estimated regression line and use it to calculate a point prediction of ammo- nium concentration for a future observation made when ammonium concentration is 25 ml/h. b. What happens if the estimated regression line is used to calculate a point estimate of true average concentration when transpiration is 45 ml/h? Why does it not make sense to calculate this point estimate? c. Calculate and interpret s. d. Do you think the simple linear regression model does a good job of explaining observed variation in con- centration? Explain.
Refer back to the data in Exercise 4, in which y = ammo- nium concentration (mg/L) and x transpiration (ml/h). Summary quantities include n = 13, Ex, = 303.7, Ey, = 52.8, S = 1585.230769, S,, = -341.959231, and S, = %3D %3D yy 77.270769. a. Obtain the equation of the estimated regression line and use it to calculate a point prediction of ammo- nium concentration for a future observation made when ammonium concentration is 25 ml/h. b. What happens if the estimated regression line is used to calculate a point estimate of true average concentration when transpiration is 45 ml/h? Why does it not make sense to calculate this point estimate? c. Calculate and interpret s. d. Do you think the simple linear regression model does a good job of explaining observed variation in con- centration? Explain.
Algebra & Trigonometry with Analytic Geometry
13th Edition
ISBN:9781133382119
Author:Swokowski
Publisher:Swokowski
Chapter7: Analytic Trigonometry
Section7.6: The Inverse Trigonometric Functions
Problem 91E
Related questions
Question
100%
If I could please receive help with parts A and B, I would greatly appreciate it. Thank you for your time and help.

Transcribed Image Text:12.
Refer back to the data in Exercise 4, in which y = ammo-
nium concentration (mg/L) and x
Summary quantities include n = 13, Er, = 303.7, Ey, =
52.8, S
transpiration (ml/h).
1585.230769, S = -341.959231, and S
xy
77.270769.
a. Obtain the equation of the estimated regression line
and use it to calculate a point prediction of ammo-
nium concentration for a future observation made
when ammonium concentration is 25 ml/h.
b. What happens if the estimated regression line is
used to calculate a point estimate of true average
concentration when transpiration is 45 ml/h? Why
does it not make sense to calculate this point
estimate?
Calculate and interpret s.
d. Do you think the simple linear regression model does
a good job of explaining observed variation in con-
centration? Explain.
с.
Expert Solution
This question has been solved!
Explore an expertly crafted, step-by-step solution for a thorough understanding of key concepts.
This is a popular solution!
Trending now
This is a popular solution!
Step by step
Solved in 2 steps with 2 images

Recommended textbooks for you

Algebra & Trigonometry with Analytic Geometry
Algebra
ISBN:
9781133382119
Author:
Swokowski
Publisher:
Cengage

Algebra & Trigonometry with Analytic Geometry
Algebra
ISBN:
9781133382119
Author:
Swokowski
Publisher:
Cengage