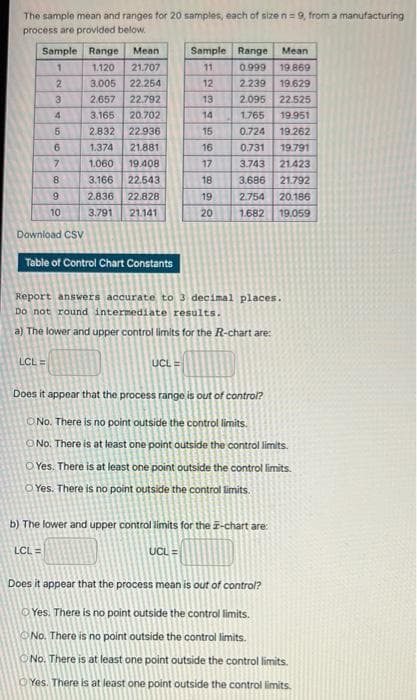
The sample mean and ranges for 20 samples, each of size n=9, from a manufacturing process are provided below. Sample Range Mean Sample Range Mean 1. 1.120 21.707 11 0.999 19.869 3.005 22.254 19.629 2.095 22.525 2. 12 2.239 3. 2.657 22.792 13 4. 3.165 20.702 14 1765 19.951 2.832 22.936 15 0.724 19.262 6. 1.374 21.881 16 0.731 19.791 7. 1.060 19.408 17 3.743 21.423 3.166 22.543 18 3.686 21.792 6. 2.836 22.828 19 2.754 20.186 10 3.791 21.141 20 1.682 19.059 Download CSV Table of Control Chart Constants Report anssvers accurate to 3 decimal places. Do not round intermediate results. a) The lower and upper control limits for the R-chart are: LCL= UCL= Does it appear that the process range is out of control? ONo. There is no point outside the control limits. O No. There is at least one point outside the control limits. O Yes. There is at least one point outside the control imits. O Yes. There is no point outside the control limits. b) The lower and upper contral limits for the -chart are: LCL = UCL= Does it appear that the process mean is out of control? O Yes. There is no point outside the control limits. ONo. There is no point outside the control limits. ONo. There is at least one point outside the control limits. OYes. There is at least one point outside the control limits
The sample mean and ranges for 20 samples, each of size n=9, from a manufacturing process are provided below. Sample Range Mean Sample Range Mean 1. 1.120 21.707 11 0.999 19.869 3.005 22.254 19.629 2.095 22.525 2. 12 2.239 3. 2.657 22.792 13 4. 3.165 20.702 14 1765 19.951 2.832 22.936 15 0.724 19.262 6. 1.374 21.881 16 0.731 19.791 7. 1.060 19.408 17 3.743 21.423 3.166 22.543 18 3.686 21.792 6. 2.836 22.828 19 2.754 20.186 10 3.791 21.141 20 1.682 19.059 Download CSV Table of Control Chart Constants Report anssvers accurate to 3 decimal places. Do not round intermediate results. a) The lower and upper control limits for the R-chart are: LCL= UCL= Does it appear that the process range is out of control? ONo. There is no point outside the control limits. O No. There is at least one point outside the control limits. O Yes. There is at least one point outside the control imits. O Yes. There is no point outside the control limits. b) The lower and upper contral limits for the -chart are: LCL = UCL= Does it appear that the process mean is out of control? O Yes. There is no point outside the control limits. ONo. There is no point outside the control limits. ONo. There is at least one point outside the control limits. OYes. There is at least one point outside the control limits

MATLAB: An Introduction with Applications
6th Edition
ISBN:9781119256830
Author:Amos Gilat
Publisher:Amos Gilat
Chapter1: Starting With Matlab
Section: Chapter Questions
Problem 1P

Related questions
Question
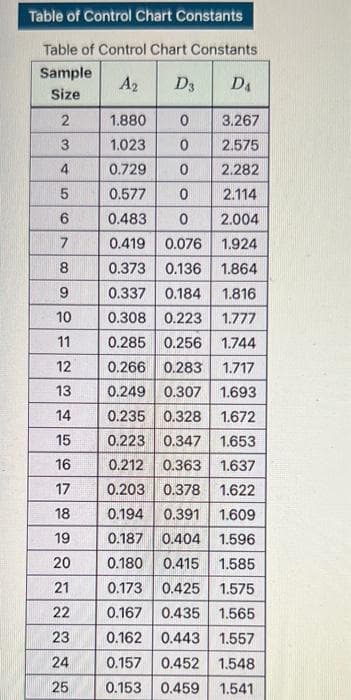
Transcribed Image Text:Table of Control Chart Constants
Table of Control Chart Constants
Sample
A2
D3
D4
Size
1.880
3.267
1.023
2.575
0.729
2.282
0.577
2.114
0.483
2.004
0.419 0.076
0.373 0.136 1.864
1.924
0.337 0.184
1.816
10
0.308 0.223
1.777
11
0.285 0.256 1.744
12
0.266 0.283 1.717
13
0.249 0.307 1.693
0.235 0.328 1.672
0.223 0.347 1.653
14
15
0.212 0.363 1.637
0.203 0.378
16
17
1.622
18
0.194
0.391
1.609
19
0.187 0.404
1.596
20
0.180 0.415
1.585
0.173 0.425
0.167 0.435 1.565
21
1.575
22
23
0.162 0.443 1.557
24
0.157 0.452 1.548
25
0.153 0.459
1.541
Transcribed Image Text:The sample mean and ranges tor 20 samples, each of sizen =9, from a manufacturing
process are provided below.
Sample Range
Mean
Sample Range
Mean
1.
1.120
21.707
11
0.999
19.869
2.
3.005
22.254
12
2.239
19.629
3.
2.657
22.792
13
2.095
22.525
3.165 20.702
2.832 22.936
4.
14
1.765
19.951
15
0.724
19.262
6.
1.374
21.881
16
0.731
19.791
1.060
19.408
17.
3.743
21.423
8
3.166
22.543
18
3.686
21.792
6.
2.836
22.828
19
2.754
20.186
10
3.791
21.141
20
1.682
19.059
Download CSV
Table of Control Chart Constants
Report answers accurate to 3 decimal places.
Do not round intermediate results.
a) The lower and upper control limits for the R-chart are:
LCL =
UCL =
Does it appear that the process range is out of control?
O No. There is no point outside the control limits.
O No. There is at least one point outside the control limits.
O Yes. There is at least one point outside the control limits.
O Yes. There is no point outside the control limits.
b) The lower and upper control limits for the -chart are:
LCL =
UCL =
Does it appear that the process mean is out of control?
O Yes. There is no point outside the control limits.
ONo. There is no point outside the control limits.
ONo. There is at least one point outside the control limits.
O Yes. There is at least one point outside the control limits.
Expert Solution
This question has been solved!
Explore an expertly crafted, step-by-step solution for a thorough understanding of key concepts.

Step by step
Solved in 3 steps with 3 images

Recommended textbooks for you
MATLAB: An Introduction with Applications
Statistics
ISBN:
9781119256830
Author:
Amos Gilat
Publisher:
John Wiley & Sons Inc

Probability and Statistics for Engineering and th…
Statistics
ISBN:
9781305251809
Author:
Jay L. Devore
Publisher:
Cengage Learning

Statistics for The Behavioral Sciences (MindTap C…
Statistics
ISBN:
9781305504912
Author:
Frederick J Gravetter, Larry B. Wallnau
Publisher:
Cengage Learning
MATLAB: An Introduction with Applications
Statistics
ISBN:
9781119256830
Author:
Amos Gilat
Publisher:
John Wiley & Sons Inc
Probability and Statistics for Engineering and th…
Statistics
ISBN:
9781305251809
Author:
Jay L. Devore
Publisher:
Cengage Learning
Statistics for The Behavioral Sciences (MindTap C…
Statistics
ISBN:
9781305504912
Author:
Frederick J Gravetter, Larry B. Wallnau
Publisher:
Cengage Learning

Elementary Statistics: Picturing the World (7th E…
Statistics
ISBN:
9780134683416
Author:
Ron Larson, Betsy Farber
Publisher:
PEARSON

The Basic Practice of Statistics
Statistics
ISBN:
9781319042578
Author:
David S. Moore, William I. Notz, Michael A. Fligner
Publisher:
W. H. Freeman

Introduction to the Practice of Statistics
Statistics
ISBN:
9781319013387
Author:
David S. Moore, George P. McCabe, Bruce A. Craig
Publisher:
W. H. Freeman