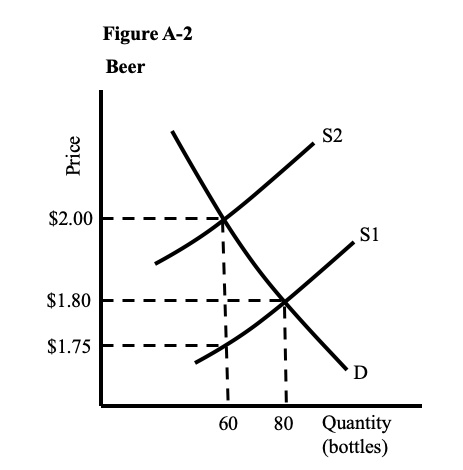
Refer to Figure A-2. The supply curve S1 and the demand curve D show the initial market equilibrium for the beer market. A $.25-per-bottle tax is on beer is placed on producers, which shifts the supply curve from S1 to S2. How much tax revenue does the $.25-per-bottle tax raise? Group of answer choices $20 $15 $120 $144
Refer to Figure A-2. The supply curve S1 and the demand curve D show the initial market equilibrium for the beer market. A $.25-per-bottle tax is on beer is placed on producers, which shifts the supply curve from S1 to S2. How much tax revenue does the $.25-per-bottle tax raise? Group of answer choices $20 $15 $120 $144

Economics Today and Tomorrow, Student Edition
1st Edition
ISBN:9780078747663
Author:McGraw-Hill
Publisher:McGraw-Hill
Chapter5: Buying The Necessities
Section5.2: Cloting Choices
Problem 1R

Related questions
Question
Refer to Figure A-2. The supply curve S1 and the demand curve D show the initial
Group of answer choices
$20
$15
$120
$144
Transcribed Image Text:Price
$2.00
$1.80
$1.75
Figure A-2
Beer
60
S2
S1
D
80 Quantity
(bottles)
Expert Solution
This question has been solved!
Explore an expertly crafted, step-by-step solution for a thorough understanding of key concepts.

This is a popular solution!

Trending now
This is a popular solution!

Step by step
Solved in 2 steps

Knowledge Booster


Learn more about
Need a deep-dive on the concept behind this application? Look no further. Learn more about this topic, economics and related others by exploring similar questions and additional content below.Recommended textbooks for you
Economics Today and Tomorrow, Student Edition
Economics
ISBN:
9780078747663
Author:
McGraw-Hill
Publisher:
Glencoe/McGraw-Hill School Pub Co
Economics Today and Tomorrow, Student Edition
Economics
ISBN:
9780078747663
Author:
McGraw-Hill
Publisher:
Glencoe/McGraw-Hill School Pub Co