Refer to the accompanying data table, which shows the amounts of nicoline (mg per cigarette) in king- size cigarettes, 100-mm menthol cigarettes, and 100 mm nonmenthol cigaretes. The king-size cigarettes are nonfiltered, while the 100 mm menthol cigarettes and the 100-mm nonmenthol cigarettes are filtered. Use a 0.05 significance level to test the claim that the three categories of cigarettes yield the same mean amount of nicotine. Given that only the king size cigarettes are not fillered, do the filters appear to make a difference? King-Size 1.6 100-mm Menthol Filtered 100-mm Nonmenthol 1.1 0.2 1.2 0.9 1.2 1.0 1.1 0.6 1.1 0.9 1.1 1.4 1.2 1.1 1.2 1.4 0.8 1.1 0.9 1.1 1.0 1.2 1.1 1.4 1.2 0.9 1.1 0.9 0.9 A Determine the null hypothesis and alternative hypothesis. B. Calculate the test statistic. C What is the P Value?
Refer to the accompanying data table, which shows the amounts of nicoline (mg per cigarette) in king- size cigarettes, 100-mm menthol cigarettes, and 100 mm nonmenthol cigaretes. The king-size cigarettes are nonfiltered, while the 100 mm menthol cigarettes and the 100-mm nonmenthol cigarettes are filtered. Use a 0.05 significance level to test the claim that the three categories of cigarettes yield the same mean amount of nicotine. Given that only the king size cigarettes are not fillered, do the filters appear to make a difference? King-Size 1.6 100-mm Menthol Filtered 100-mm Nonmenthol 1.1 0.2 1.2 0.9 1.2 1.0 1.1 0.6 1.1 0.9 1.1 1.4 1.2 1.1 1.2 1.4 0.8 1.1 0.9 1.1 1.0 1.2 1.1 1.4 1.2 0.9 1.1 0.9 0.9 A Determine the null hypothesis and alternative hypothesis. B. Calculate the test statistic. C What is the P Value?

MATLAB: An Introduction with Applications
6th Edition
ISBN:9781119256830
Author:Amos Gilat
Publisher:Amos Gilat
Chapter1: Starting With Matlab
Section: Chapter Questions
Problem 1P

Related questions
Topic Video
Question
100%
Transcribed Image Text:Document1 - Word
2 Search
Home
Insert
Draw
Design
Layout
References
A Laura
Mailings
Review
View
Help
Times New Roma
12
A A
A Share
BIU ab x,
AaBbCcD AaBbCcD AaBbC AABBCCC AaB
PFind -
x' A -
e A-
三= 。 ,田▼
1 No Spac. Heading
e Replace
1 Normal
Heading 2
Title
Dictate
Editor
Reuse
Select
Font
Files
Paragraph
Styles
Practice Problems
Editing
Voice
Editor
Reuse File
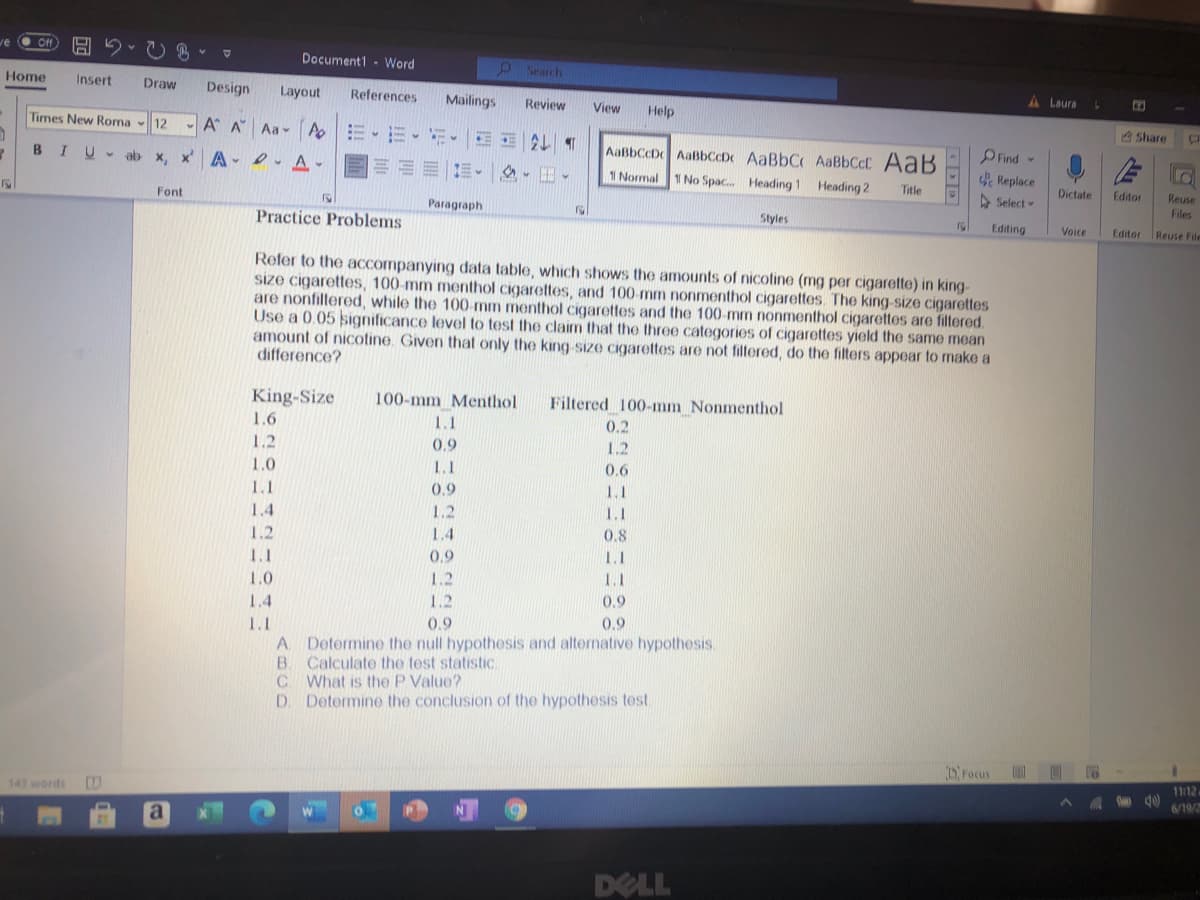
Refer to the accompanying data table, which shows the amounts of nicotine (mg per cigarette) in king-
size cigarettes, 100-mm menthol cigarettes, and 100-mm nonmenthol cigarettes. The king-size cigarettes
are nonfiltered, while the 100-mm menthol cigarettes and the 100-mm nonmenthol cigarettes are filtered.
Use a 0.05 significance level to test the claim that the three categories of cigarettes yield the same mean
amount of nicotine. Given that only the king-size cigarettes are not filtered, do the filters appear to make a
difference?
II
King-Size
100-mm Menthol
Filtered 100-mm Nonmenthol
1.6
1.1
0.2
1.2
0.9
1.2
1.0
1.1
0.6
1.1
0.9
1.1
1.4
1.2
1.1
1.2
1.4
0.8
1.1
0.9
1.1
1.0
1.2
11
1.4
1.2
0.9
0.9
1.1
A Determine the null hypothesis and alternative hypothesis.
B.
0.9
Calculate the test statistic.
C What is the P Value?
D Determine the conclusion of the hypothesis test.
DFocus
11:12
143 words
6/19/2
DELL
Expert Solution
This question has been solved!
Explore an expertly crafted, step-by-step solution for a thorough understanding of key concepts.

This is a popular solution!

Trending now
This is a popular solution!

Step by step
Solved in 3 steps

Knowledge Booster


Learn more about
Need a deep-dive on the concept behind this application? Look no further. Learn more about this topic, statistics and related others by exploring similar questions and additional content below.Recommended textbooks for you
MATLAB: An Introduction with Applications
Statistics
ISBN:
9781119256830
Author:
Amos Gilat
Publisher:
John Wiley & Sons Inc

Probability and Statistics for Engineering and th…
Statistics
ISBN:
9781305251809
Author:
Jay L. Devore
Publisher:
Cengage Learning

Statistics for The Behavioral Sciences (MindTap C…
Statistics
ISBN:
9781305504912
Author:
Frederick J Gravetter, Larry B. Wallnau
Publisher:
Cengage Learning
MATLAB: An Introduction with Applications
Statistics
ISBN:
9781119256830
Author:
Amos Gilat
Publisher:
John Wiley & Sons Inc
Probability and Statistics for Engineering and th…
Statistics
ISBN:
9781305251809
Author:
Jay L. Devore
Publisher:
Cengage Learning
Statistics for The Behavioral Sciences (MindTap C…
Statistics
ISBN:
9781305504912
Author:
Frederick J Gravetter, Larry B. Wallnau
Publisher:
Cengage Learning

Elementary Statistics: Picturing the World (7th E…
Statistics
ISBN:
9780134683416
Author:
Ron Larson, Betsy Farber
Publisher:
PEARSON

The Basic Practice of Statistics
Statistics
ISBN:
9781319042578
Author:
David S. Moore, William I. Notz, Michael A. Fligner
Publisher:
W. H. Freeman

Introduction to the Practice of Statistics
Statistics
ISBN:
9781319013387
Author:
David S. Moore, George P. McCabe, Bruce A. Craig
Publisher:
W. H. Freeman