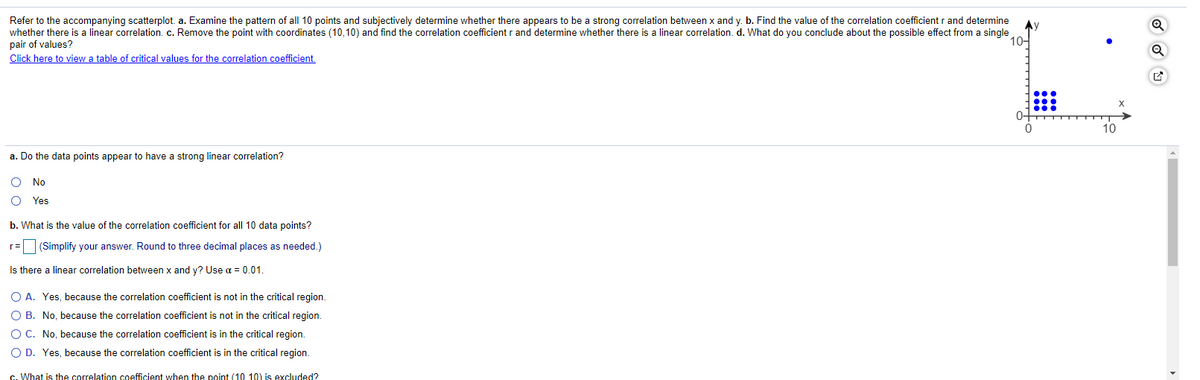
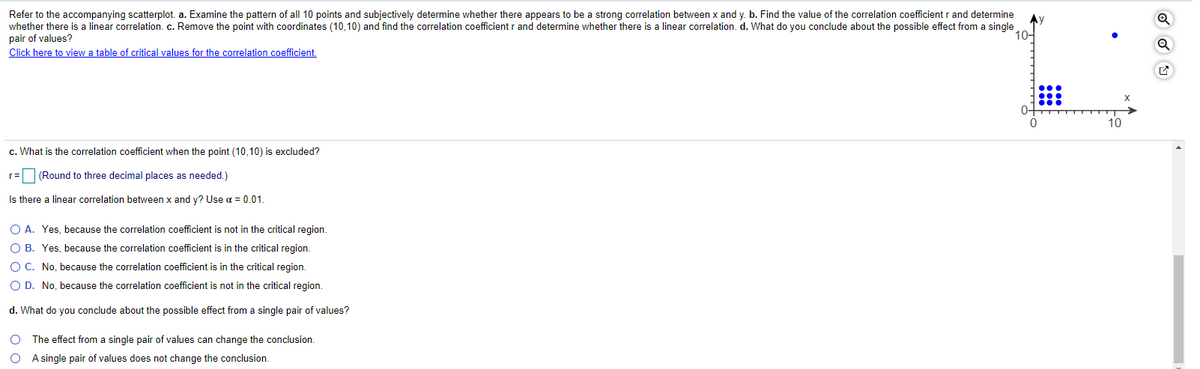
Refer to the accompanying scatterplot. a. Examine the pattern of all 10 points and subjectively determine whether there appears to be a strong correlation between x and y. b. Find the value of the correlation coefficient r and determine whether there is a linear correlation. c. Remove the point with coordinates (10,10) and find the correlation coefficient r and determine whether there is a linear correlation. d. What do you conclude about the possible effect from a single pair of values? a. Do the data points appear to have a strong linear correlation? b. What is the value of the correlation coefficient for all 10 ndata points? Is there a linear correlation between x and y? Use α= 0.01. c. What is the correlation coefficient when the point(10,10)is excluded? Is there a linear correlation between x and y? Use α=0.01. d. What do you conclude about the possible effect fr


Correlation
Correlation defines a relationship between two independent variables. It tells the degree to which variables move in relation to each other. When two sets of data are related to each other, there is a correlation between them.
Linear Correlation
A correlation is used to determine the relationships between numerical and categorical variables. In other words, it is an indicator of how things are connected to one another. The correlation analysis is the study of how variables are related.
Regression Analysis
Regression analysis is a statistical method in which it estimates the relationship between a dependent variable and one or more independent variable. In simple terms dependent variable is called as outcome variable and independent variable is called as predictors. Regression analysis is one of the methods to find the trends in data. The independent variable used in Regression analysis is named Predictor variable. It offers data of an associated dependent variable regarding a particular outcome.
Refer to the accompanying
a. Do the data points appear to have a strong linear correlation?
b. What is the value of the correlation coefficient for all 10 ndata points?
Is there a linear correlation between x and y? Use α= 0.01.
c. What is the correlation coefficient when the point(10,10)is excluded?
Is there a linear correlation between x and y? Use α=0.01.
d. What do you conclude about the possible effect from a single pair of values?


Trending now
This is a popular solution!

Step by step
Solved in 2 steps


