Refer to the Baseball data: 1) At the 0.05 significance level, can we conclude that there is a difference in the mean salary of teams in the American League versus teams in the National League? 2) At the 0.05 significance level, can we conclude that there is a difference in the mean home attendance of teams in the American League versus teams in the National League? 3) Compute the mean and the standard deviation of the attendance for the 10 teams with the highest salaries. Do the same for the 10 teams with the lowest salaries. At the .05 significance level, is there a difference in the mean attendance for the two groups?
Refer to the Baseball data: 1) At the 0.05 significance level, can we conclude that there is a difference in the mean salary of teams in the American League versus teams in the National League? 2) At the 0.05 significance level, can we conclude that there is a difference in the mean home attendance of teams in the American League versus teams in the National League? 3) Compute the mean and the standard deviation of the attendance for the 10 teams with the highest salaries. Do the same for the 10 teams with the lowest salaries. At the .05 significance level, is there a difference in the mean attendance for the two groups?

Linear Algebra: A Modern Introduction
4th Edition
ISBN:9781285463247
Author:David Poole
Publisher:David Poole
Chapter4: Eigenvalues And Eigenvectors
Section4.3: Eigenvalues And Eigenvectors Of N X N Matrices
Problem 34EQ

Related questions
Topic Video
Question
100%
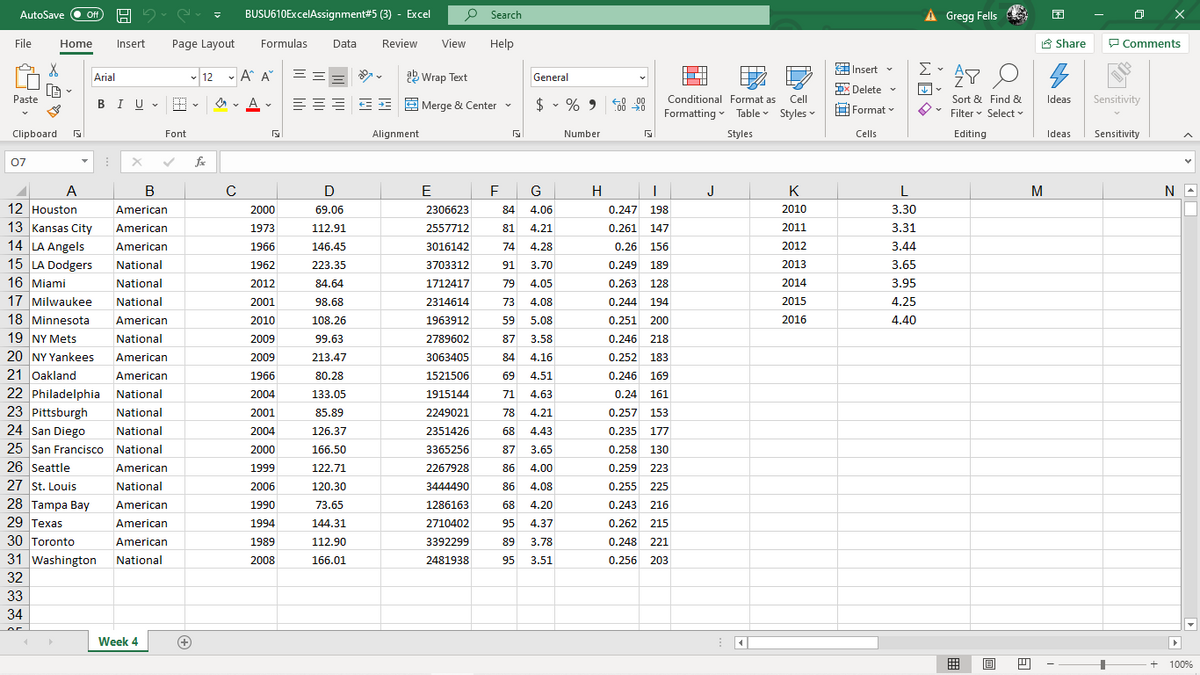
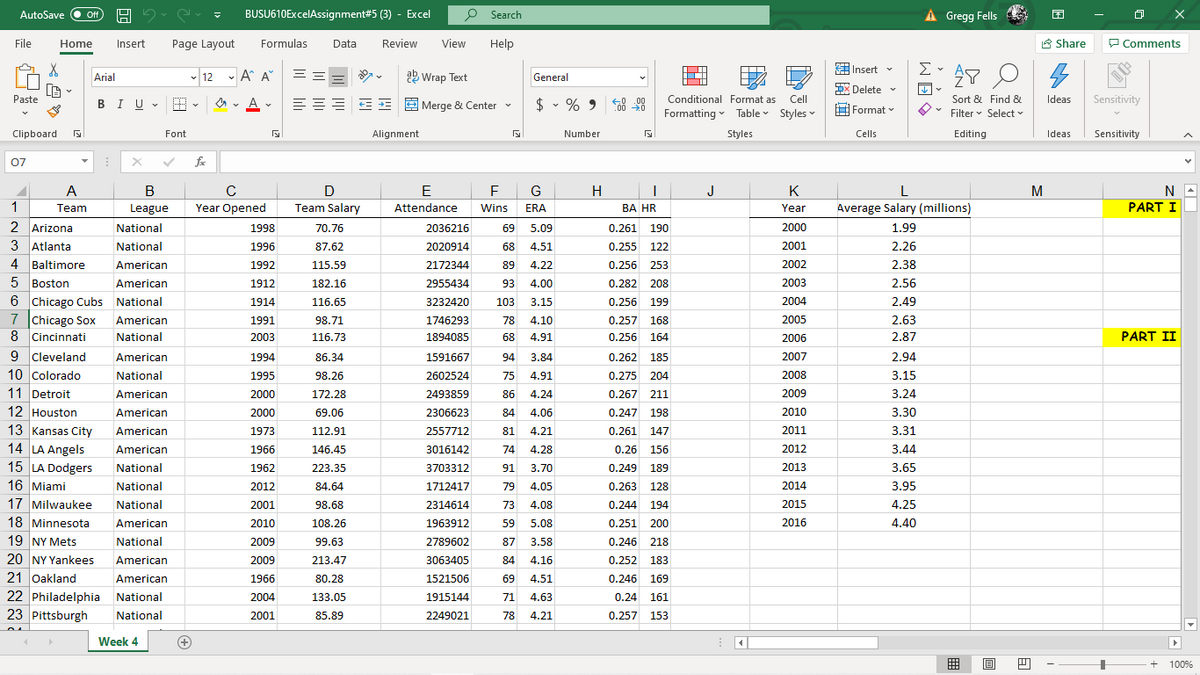
| Refer to the Baseball data: |
| 1) At the 0.05 significance level, can we conclude that there is a difference in the |
| 2) At the 0.05 significance level, can we conclude that there is a difference in the mean home attendance of teams in the American League versus teams in the National League? |
| 3) Compute the mean and the standard deviation of the attendance for the 10 teams with the highest salaries. Do the same for the 10 teams with the lowest salaries. At the .05 significance level, is there a difference in the mean attendance for the two groups? |
Transcribed Image Text:BUSU610ExcelAssignment#5 (3) - Excel
P Search
A Gregg Fells
AutoSave
ff
File
Home
Insert
Page Layout
Formulas
Data
Review
View
Help
A Share
P Comments
E
Insert v
Σ
- 12 - A A"
==
a Wrap Text
Arial
General
DX Delete v
LiA
Paste
Sensitivity
BIU -
A
= E E Merge & Center -
$ - % 9 58 99
Conditional Format as
Cell
Sort & Find &
Ideas
.00
Formatting - Table Styles v
H Format v
O* Filter v Select
Clipboard
Font
Alignment
Number
Styles
Cells
Editing
Ideas
Sensitivity
07
fe
A
В
D
E
G
H
J
K
L
M
N
12 Houston
American
2000
69.06
2306623
84
4.06
0.247 198
2010
3.30
13 Kansas City
14 LA Angels
15 LA Dodgers
16 Miami
17 Milwaukee
American
1973
112.91
2557712
81
4.21
0.261 147
2011
3,31
American
1966
146.45
3016142
74
4.28
0.26 156
2012
3.44
National
1962
223.35
3703312
91
3.70
0.249
189
2013
3.65
National
2012
84.64
1712417
79
4.05
0.263 128
2014
3.95
National
2001
98.68
2314614
73
4.08
0.244 194
2015
4.25
18 Minnesota
19 NY Mets
American
2010
108.26
1963912
59
5.08
0.251 200
2016
4.40
National
2009
99.63
2789602
87
3.58
0.246 218
20 NY Yankees
American
2009
213.47
3063405
84
4.16
0.252
183
21 Oakland
American
1966
80.28
1521506
69 4.51
0.246 169
22 Philadelphia National
23 Pittsburgh
24 San Diego
25 San Francisco National
26 Seattle
2004
133.05
1915144
71
4.63
0.24 161
National
2001
85.89
2249021
78
4.21
0.257 153
National
2004
126.37
2351426
68
4.43
0.235
177
2000
166.50
3365256
87 3.65
0.258 130
American
1999
122.71
2267928
86
4.00
0.259
223
27 St. Louis
National
2006
120.30
3444490
86
4.08
0.255
225
28 Tampa Bаy
1286163
0.243 216
American
1990
73.65
68
4.20
29 Техas
American
1994
144.31
2710402
95
4.37
0.262 215
30 Toronto
American
1989
112.90
3392299
89
3.78
0.248 221
31 Washington National
2008
166.01
0.256 203
2481938
95
3.51
32
33
34
Week 4
(+
100%
Transcribed Image Text:BUSU610ExcelAssignment#5 (3) - Excel
P Search
A Gregg Fells
AutoSave
ff
File
Home
Insert
Page Layout
Formulas
Data
Review
View
Help
A Share
P Comments
E
Insert v
Σ
- 12 - A A"
==
a Wrap Text
Arial
General
DX Delete v
LiA
Paste
Sensitivity
Conditional Format as
Cell
Ideas
BIU -
A
= E E Merge & Center -
$ - % 9 8 98
Sort & Find &
Ov Filter v Select
Formatting - Table Styles v
H Format
Clipboard
Font
Alignment
Number
Styles
Cells
Editing
Ideas
Sensitivity
07
fe
A
В
D
E
G
H
J
K
L
M
N
1
Team
League
Year Opened
Team Salary
Attendance
Wins
ERA
ВА HR
Year
Average Salary (millions)
PART I
2 Arizona
National
1998
70.76
2036216
69
5.09
0.261 190
2000
1.99
3 Atlanta
National
1996
87.62
2020914
68
4.51
0.255 122
2001
2.26
4 Baltimore
American
1992
115.59
2172344
89
4.22
0.256
253
2002
2.38
5 Boston
American
1912
182.16
2955434
93
4.00
0.282 208
2003
2.56
6 Chicago Cubs National
7 Chicago Sox American
8 Cincinnati
1914
116.65
3232420
103
3.15
0.256 199
2004
2.49
1991
98.71
1746293
78
4.10
0.257 168
2005
2.63
National
2003
116.73
1894085
68
4.91
0.256 164
2006
2.87
PART II
9 cleveland
10 Colorado
11 Detroit
12 Houston
American
1994
86.34
1591667
94
3.84
0.262
185
2007
2.94
National
1995
98.26
2602524
75
4.91
0.275 204
2008
3.15
American
2000
172.28
2493859
86
4.24
0.267 211
2009
3.24
American
2000
69.06
2306623
84
4.06
0.247 198
2010
3.30
13 Kansas City
14 LA Angels
15 LA Dodgers
American
1973
112.91
2557712
81
4.21
0.261 147
2011
3.31
American
1966
146.45
3016142
74 4.28
0.26 156
2012
3,44
National
1962
223.35
3703312
91
3.70
0.249 189
2013
3.65
16 Miami
17 Milwaukee
18 Minnesota
National
2012
84.64
1712417
79
4.05
0.263
128
2014
3.95
National
2001
98.68
2314614
73
4.08
0.244 194
2015
4.25
American
2010
108.26
1963912
59
5.08
0.251 200
2016
4.40
19 NY Mets
National
2009
99.63
2789602
87
3.58
0.246 218
20 NY Yankees
21 Oakland
American
2009
213.47
3063405
84
4.16
0.252 183
American
1966
80.28
1521506
69
4.51
0.246 169
22 Philadelphia National
23 Pittsburgh
2004
133.05
1915144
71 4.63
0.24 161
National
2001
85.89
2249021
78
4.21
0.257
153
Week 4
+
100%
Expert Solution
This question has been solved!
Explore an expertly crafted, step-by-step solution for a thorough understanding of key concepts.

This is a popular solution!

Trending now
This is a popular solution!

Step by step
Solved in 5 steps with 10 images

Knowledge Booster


Learn more about
Need a deep-dive on the concept behind this application? Look no further. Learn more about this topic, statistics and related others by exploring similar questions and additional content below.Recommended textbooks for you
Linear Algebra: A Modern Introduction
Algebra
ISBN:
9781285463247
Author:
David Poole
Publisher:
Cengage Learning
Linear Algebra: A Modern Introduction
Algebra
ISBN:
9781285463247
Author:
David Poole
Publisher:
Cengage Learning