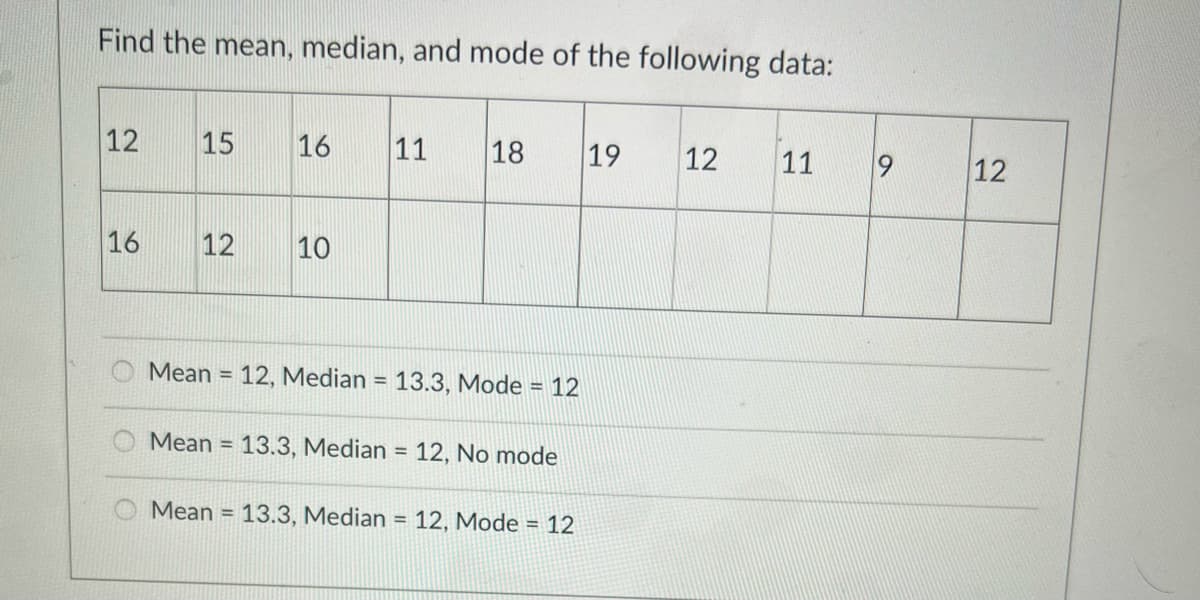
Find the mean, median, and mode of the following data: 12 15 16 11 18 19 12 11 12 16 12 10 Mean = 12, Median = 13.3, Mode = 12 %3D %3D Mean = 13.3, Median = 12, No mode %3D Mean = 13.3, Median = 12, Mode = 12


Q: Sales volume last weekend for a sample of ten car dealerships were as follows: Data Point 1 3 6. 8.…
A: Introduction :- We have to calculate the sample variance.
Q: Example 3.3: Calculate the mean, median, and mode for the following data. Number of people Age 17 -…
A:
Q: Consider the data set 5 3 6 1 6 4 4 Find the average (mean): Find the median:
A: Explanation of the answer is as follows
Q: 5. Which of the following is the most appropriate measure of central tendency for nominal data? (A)…
A: The mode is the measure which gives the most frequent value and nominal data is the type of data…
Q: Consider the following data consisting of 9 values: Data 19 16 7 10 17 20 The minimum is The first…
A:
Q: At the .01 significance level, does the data below show significant correlation? y 5 35.23 37.66 7…
A: Given :
Q: 10 11 12 13 15 15 16 17 18 18 What is the mean median and mode of this data in descriptive stat
A: Consider, X = 10, 11, 12, 13, 15, 15, 16, 17, 18, 18 The mean for the provided data set can be…
Q: Find the mean, median and mode of the given grouped data. Classes f 11-22 2…
A: Calculate Mean, Median, Mode from the following grouped data Class Frequency 11 - 22 2 23 -…
Q: Find the coefficient of correlation for the following table: 18 22 х: 10 14 26 30 у: 18 12 24 6 30…
A: Correlation coefficient measures the strength and direction of the linear relationship between two…
Q: Consider the data set 2 3 1 1 8 1 2 7 Find the average (mean): Find the median: 5.
A:
Q: The final grades of a student in his subjects where he was enrolled were taken and shown below.…
A: Given Information: Subject No. of units (wi) Final grade (xi) Math 1 3 2.5 Lab…
Q: Find the mean, median, mode, and range for the following set of data: 12 15 16 11 18 19 12 11 9 12…
A:
Q: The following sample data contains the number of years of college and the current annual salary for…
A: Here, the data was collected in order to study the effect of annual income (Y) based on 2 variables:…
Q: Calculate the mean, median, standard deviation, variance, coefficient of variation, and RSD, for the…
A: Given data set is19.41,19.52,19.63,19.84,20.16,20.38
Q: At the .05 significance level, does the data below show significant correlation? X y 16.05 4 21.1 5…
A: 1. The correlation coefficient is 0.9376 using the Excel formula “=CORREL(F1:F14,G1:G14)” 2) The…
Q: Determine if there is a significant correlation between the sets of data at a 10% significance…
A: From the given information, the claim of the problem is the significant correlation between X and…
Q: Consider the data set 7 2 1 6 9 9 9 9 7 6 Find the average (mean): Find the median:
A:
Q: 1b) Calculate the mean deviation from the mean for the following data: Size : 4 8. 10 12 14 16…
A: We have given that, Date set in the form of size and frequency is, Xi = 2 4 6 8 10…
Q: Consider the following data and answer the following questions. Data: 1, 2, 3, 6, 7, 8, 12, 15, 18,…
A: here use basic of percentile, and some measures of central tendency here given data…
Q: 1. For the data set: x1: 15 16 17 18 19 20 x2:2 5 10 25 6 2 a) find the mean, median, mode, and…
A:
Q: Calculate arithmetic mean or mean, median and mode transport cost for students.
A: Given lower limit upper limit Number of students 20 30 3 30 40 5 40 50 20 50 60 10 60…
Q: Enter the mode of the following dataset: 14, 14, 14, 22, 22, 4, 18, 16, 10 Ex: 1
A: Given data is: 14, 14, 14, 22, 22, 4, 18, 16, 10
Q: Recall the following salary data from 10 Lad Factory employees. Staff 1 2 3 4 5 6 7 8 9…
A: Given: Staff Salary (in k) 1 20 2 21 3 22 4 20 5 19 6 20 7 18 8 21 9 100 10…
Q: Consider the following data set: 0, 2, 2, 3, 5, 6, 3 (a) µ = (b) Variance = (c) σ = (Round…
A: Given data 0,2,2,3,5,6,3 n=7
Q: A random sample of response times in minutes of the Farmington Volunteer Ambulance Corps was reco 14…
A: Given data, 14,20,29,24,25,10,14,28,12,18,16,12,14,26,24,13,20,24,25,18 Sort the data in ascending…
Q: An environmentalist wanted to determine if the mean acidity of rain differed among Alaska, Florida,…
A: a) Here we study mean acidity of rain at different locations, hence acidity of rain is response…
Q: 7. Compute mean deviation from mean and median from the following data : Height in cms 158 159 160…
A: Given data is Heights in cms 158 159 160 161 162 163 164 165 166 No.of persons 15 20 32 35 33…
Q: Which of the following data types would not be considered quantitative data? Heights of basketball…
A: Quantitative data is a data which can be measured numerically and operations like addition,…
Q: Consider the data set 3 8 8 4 9 Find the average (mean): Find the median: 2.
A: Given data, 3,1,8,7,6,5,8,2,4,9 Sort the data in ascending order. 1,2,3,4,5,6,7,8,8,9
Q: Find the median and mean deviation of the following data; Frequency 7 12 15 25 Size 40-50 50-60…
A:
Q: Examine the following data set. 1.3, 2.5, 3.1, 4.2, 5.7, 5.7, 5.7, 6.4, 6.4, 8.9, 8.9, 9.1, 11.7,…
A: We have given the following set of data- 1.3, 2.5, 3.1, 4.2, 5.7, 5.7, 5.7, 6.4, 6.4, 8.9, 8.9, 9.1,…
Q: From these sets of data, which of the following is more reliable? Discuss. DATA SET A: Mean: 54.6;…
A: Given: : DATA SET A: Mean: 54.6; variance: 0.21DATA SET B: Mean: 54.6; variance: 0.52
Q: A textile manufacturer obtained a sample of 50 bolts of cloth from a day’s output. Each bolt is…
A: The cumulative frequencies are obtained in the below table:
Q: Find Mean, Median, and Mode for the ungrouped data: 18 20 20 20 20 21 20 17 19 20 13 18 22 26 20 19…
A:
Q: Which of the following statements is true for the following data values: 7 5, 6, 4, 7,8 and 12? O…
A:
Q: Consider the following data. 0,-11,-11,- 11, -9, 0,0 Step 1 of 3: Determine the mean of the given…
A: Mean: The mean is the sum of observations divided by the number of observations. that is, Mean = x =…
Q: At the .05 significance level, does the data below show significant correlation? y 5 22.1 6 20.35 7…
A: X:5,6,7,8,9,10,11 Y:22.1,20.35,17.2,16.85,8.2,17.45,17
Q: Which of the following sets of data is most likely to produce a significant t statistic? Select…
A:
Q: The semi-averages of the below given data are: Year Rainfall 1999 21 2000 11 2001 14 2002 16 2003 18
A:
Q: 1. Consider the data below. This data represents the number of miles per gallon that 30 selected…
A: The provided data represents the number of miles per gallon that 30 selected four-wheel drive sports…
Q: Given the following frequency table of values, is the mean or the median likely to be a better…
A:
Q: For the data set: xi: 15 16 17 18 19 20 ni: 2 5 10 25 6 2 a) find the mean, median, mode, and…
A:
Q: Hakims shoes reported the following sales results Size 4 5 6…
A: Given data size 4 5 6 7 8 9 10 frequency 5 11 15…
Q: Consider the following data. Which of the following options best describes the relationships between…
A: The given plot shows the dot plot.
Q: The semi-averages of the below given data are: Year Rainfall 1999 21 2000 11 2001 14 2002 16 2003 18…
A:
Q: The following set of data is given 2; 4; 5; 3; 6; 2; 3 Determine the value of coefficient of…
A: From the provided information, The mean and standard deviation of the data can be obtained as:
Q: Determine if there is a significant negative correlation between the sets of data at a 10%…
A: From the given information, the claim of the problem is the significant negative correlation between…
Q: Use the following Boxplot to answer the following question: 25 50 75 100 125 150 175 200 225 250 275…
A: The box plot:
Q: Σ * 00 T Question 10 Consider the data set 1. 2 8. 5. 5. 5. 2 6 1 2 . Find the average (mean): Find…
A: We have given data 1 2 8 5 5 5 2 6 1 2 sample size n=10 Mean = sum of all observations / total…
Q: The general manager of a chain of furniture stores believes that experience is the most important…
A: Scatter plot is used to represent the relation between two variables graphically. If the dots…


Trending now
This is a popular solution!

Step by step
Solved in 2 steps with 2 images

- The table shows the lifetimes in hours of samples from three different types of plant species exposed to a pesticide. Determine whether there is a difference between the three types a significance level 0.01 Sample 1 457 461 459 Sample 2 454 456 458 455 452 Sample 3 460 458 456 458 What is the variation between treatment ?A random survey of enrollment at 10 community colleges across the United States yielded the following figures: 2523; 1707; 5420; 2835; 1129; 5452; 2360; 1448; 2958; and 4110. What is the 99% Error Bound (EBM) of the population mean?A sociologist was hired by a large city hospital to investigate the relationship between the number of unauthorized days that employees are absent per year and the distance(miles) between home and work for the employee. A sample of 10 employees was chosen, and the following data were collected.