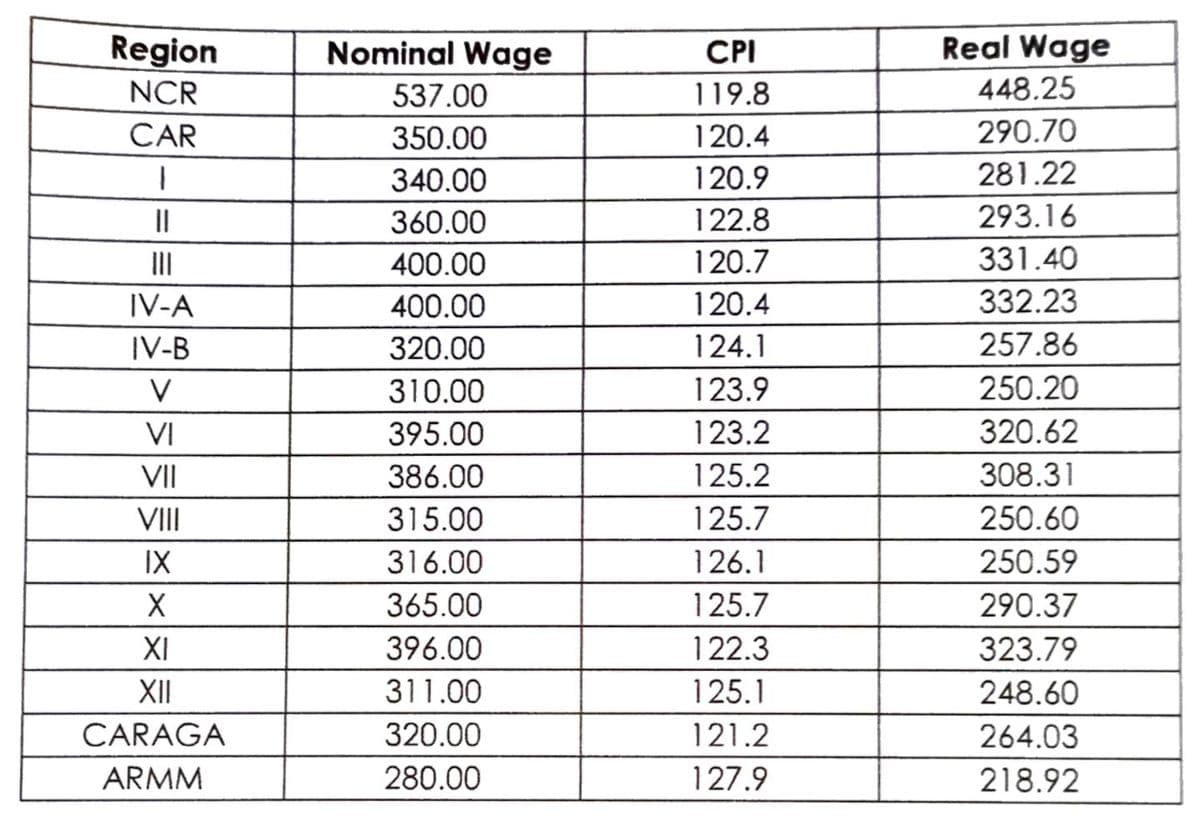
Referring to the data, how many regions are above the 80th percentile of the nominal wage? A. 3 B. 4 C. 5 D. 6


Q: 3. How many 3-digit numbers can be formed from the digits 1, 2, 3, 5, 6, 7, 8 and 9 if repetition of...
A:
Q: In a survey of 4026 adults, 708 oppose allowing transgender students to use the bathrooms of the op...
A:
Q: 3.The test scores of 80 students are normally distributed with mean of 70 and and standard deviation...
A:
Q: Baby weights: The weight of male babies less than 2 months old in the United States is normally dist...
A:
Q: Assume a dependent variable y is related to an independent variables x, and x, by the following line...
A: Introduction: The dependent variable is y, and the independent variables are x1 and x2. Denote the p...
Q: Table 1 displays the measurements of drying time, in hours, of a certain brand of latex paint. Table...
A: Using the given data Answer the given questions
Q: We would like to fit a linear regression estimate to the dataset D = {(x"), y), (x(), y(2),... , (xN...
A: Given that to fit linear regression estimate to dataset D=x1,y1, x2,y2,..., xN,yN with xi∈ℝM by mini...
Q: researcher wants to test the null hypothesis Ho:p= 0.79 against the alternative H,:p > 79. A sample ...
A: Given that Test statistic z =3 Population proportion p=0.79 P-value =0.0001
Q: Determine the given in each problem and solve for the statistical value z. 1. The average birth wei...
A: Given that Sample size n =200 Sample mean =2750 Population mean =3000 Population standard deviation...
Q: A researcher wishes to try three different techniques to lower the blood pressure of individuals dia...
A:
Q: In a test of the effectiveness of garlic for lowering cholesterol, 45 subjects were treated with ga...
A: The mean is 4.7 and standard deviation is 17.1.
Q: QUESTION 2 What is the mean Ua of the sampling distribution for the proportion of "e"s contained in ...
A:
Q: 2.3 Let A and B be two events af the same sample space. If A and B are independent and P(A) = 0.5 an...
A:
Q: You'd like to test the null hypothesis that the means of the two samples (column A and column B) are...
A: There are two independent samples which follows normal distribution. We have to test whether the mea...
Q: 1. Ten freshmen civil engineering students took a test in Mathematics (x) and Chemistry (y). Their s...
A: Here use basic of correlation coefficient
Q: Thirty Asian Utility vehicles were tested for biodiesel fuel efficiency (in km/liter). The following...
A: Given frequency distribution: Class Frequency 8-12 3 13-17 5 18-22 15 23-27 5 28-32 2 ...
Q: How many polygons can be possibly formed from 8 distinct points in which no three of which are colli...
A:
Q: 1. 3 7. 10 13 P(X) 0.2 0.9 0.7 0.6 10 11 P(X) -0.1 0.4 0.7 0.8 1 3 P(X) 0.3 0.2 0.2 0.3
A:
Q: Estimate the variance of the number of FHH members. Upload a snapshot of your solution. Estimate th...
A: For FHH size, Mean=Average of the valuesNumber of values =3+4+5+5+6+5+6+3+6+7+4+5+3+6+515 ...
Q: Exercise 5: Confidence Intervals for the Population Proportion On May 6, 2021, Pew Research Center p...
A: Confidence interval : A confidence interval depicts the probability that a parameter can fall betwee...
Q: В. X2 Χ X2 Χ X2 2 1 3 4 3. 3 5 4. 4. ΣΧΣΧ ΣΧ ΣΧ EX = ΣΧ= ΣΧ2 = 5 Χ
A:
Q: [itemD4] (refer to the photo below) Describe the pattern between the wolf (predator) population in r...
A: Given The graph is as follows:
Q: Ina study of government financial aid for college students, it becomes necessary to estimate the per...
A: GivenMargin of error(E)=0.05Confidence level = 90%
Q: An oceanographer claims that the mean dive duration of a North Atlantic right whale is 11.3 minutes....
A: Given: Sample size, n=35Sample mean, x¯=12.2Sample sd, s=2.2
Q: In 1998, as an advertising campaign, the Nabisco Company announced a “1000 Chips Challenge,” claimin...
A:
Q: Ten freshmen civil engincering students took a test in Mathematics (x) and Chemistry (y). Their scor...
A: Given data is x 12 15 8 10 6 10 11 5 7 9 y 13 16 7 11 9 12 9 6 8 9
Q: n engineer asserts that Battery A outperforms Battery B in terms of overall performance. Type A and ...
A:
Q: 8. The Muscat Distributing Company is investigating two different scheduling methods for its truck d...
A: Introduction: Coefficient Of variation: The coefficient of variation is the relative measure of dis...
Q: Current Attempt in Progress If a p-value for a hypothesis test = .02, that means that approximately ...
A: We have a given statement : if p value for a hypothesis test = . 02
Q: Given data, a) graph the frequency distribution of error
A: a. From the given information, Error 0.04 0.1089 10.0489 0.09 0.0081 1.5376 0.6889...
Q: Let X be a random variable with p.d.f f(x) = 2x,0 < x < 1. Find E(Vx) 2/3 5/4 3/2 O 4/5
A:
Q: A sample of birth weights of 48 girls was taken. Below are the results (in g):
A:
Q: Suppose a game in which, on any play, a player has a 25% chance of winning Tk. 40 and 75% chance of ...
A: Given that Probability mass function of X is x -15 40 P(X=x) 0.75 0.25
Q: Is this data set normal? Test Score Frequency 50 25 >100 30 O Yes O What's Normal? O Cannot tell O N...
A: Is the given data set Normal ?
Q: Researchers conducted trials to investigate the effects of color on creativity. Subjects with a red ...
A: The objective is to test the claim that the blue color enhances the performance of a creative task a...
Q: Seventy million pounds of trout are grown in the U.S. every year. Farm-raised trout contain an avera...
A: The random variable X follows normal distribution. We have to find the probability of observing a sa...
Q: 8. The Muscat Distributing Company is investigating two different scheduling methods for its truck d...
A: For Method A Observation: XX X^2X2 1 6 36 2 14 196 3 19 361 4 11 121 5 10 100 6 6 36 ...
Q: A sample of size 60 will be drawn from a population with mean 31 and standard deviation 6. Use the T...
A:
Q: CO2, the owner of an apple plantation, plans to replace the brand of fertilizer that they currently ...
A: The random variable X follows normal distribution. We have to find the probability that the brand of...
Q: Find the z-scores that separate the middle 86% of the distribution from the area in the tails of the...
A: Solution-: We find the z-scores that separate the middle 86% of the distribution from the area in th...
Q: can you explain in 800 words, the application of work sampling in healthcare?
A: The application of work sampling is used to calculate the proportion of time spents by workers also...
Q: Reading proficiency: An educator wants to construct an 80% confidence interval for the proportion of...
A:
Q: If the null hypothesis for an independent group t test is not supported, then the t test should be: ...
A: Solution-: If the null hypothesis for an independent group t-test is not supported, then the t-test ...
Q: A study was conducted by Grade 11 STEM students to investigate the health hazards of working long ho...
A:
Q: Below, n is the sample size, p is the population proportion of successes, and X is the number of s...
A: If each trial has only two possible outcomes, that is, success and failure, the probabilities of suc...
Q: I collected two samples of data, and found that the assumption of homogeneity of variance was violat...
A: Given information: s1=10, n1=35s2=45, n2=35
Q: The Sweet Encounter is a touring international candy festival. The festival's most popular product i...
A:
Q: For each of the following transition matrices, do the following: (1) Determine whether the Markov ch...
A: If there are more than one communication class then the markov chain is reducible. If all the states...
Q: What is the carrying capacity of this graph?
A: Here Given Logistic graph for Number of individual vs Generations
Q: Find the area of the shaded region. The graph to the right depicts IQ scores of adults, and those sc...
A:
1. Referring to the data, how many regions are above the 80th percentile of the nominal
wage?
A. 3
B. 4
C. 5
D. 6

Step by step
Solved in 2 steps

- Two different types of injection-moulding machines are used to form plastic parts. A part is considered defective if it has excessive shrinkage or is discoloured. Two random samples, each of size 300, are selected, and 13 defective parts are found in the sample from machine 1, and 8 defective parts are found in the sample from machine 2. Is it reasonable to conclude that both machines produce the same fraction of defective parts, using α = 0.05, find the value of zcalc? Please report your answer upto 2 decimal places.A consumer-testing agency wants to evaluate the claim made by a manufacturer of discount tires. The manufacturer claims that its tires can be driven at least 35,000 miles before wearing out. To determine the average number of miles that can be obtained from the manufacturer’s tires, the agency randomly selects 60 tires from the manufacturer’s warehouse and places the tires on 15 cars driven by test drivers on a 2-mile oval track. The number of miles driven (in thousands of miles) until the tires are determined to be worn out is given in the following table. Car Miles Driven 1 25 2 27 3 35 4 42 5 28 6 37 7 40 8 31 9 29 10 33 11 30 12 26 13 31 14 28 15 30 Average 31.47 Standard 5.04 Agency would like to know if the manufacturer’s claim is false. Carryout an appropriate hypothesis test (use 1% significance level). Check any assumptions you think are relevant before doing the text.The reputation (and hence, sales) of many businesses can be severely damaged by shipments of manufactured items that contain an unusually large percentage of defectives. For example, a manufacturer of flashbulbs for cameras may want to be reasonably certain that less than 5% of the bulbs are defective. Suppose 300 bulbs are randomly selected from a very large shipment, each is tested, and 10 defective bulbs are found. Does this provide sufficient evidence for the manufacturer to conclude that the fraction defective in the entire shipment is less than 0.05? Use =0.01. A B x1=365 x2=352 s1=23 s2=41
- A consumer testing agency wants to evaluate the claim made by a manufacturer of discount tires. The manufacturer claims that its tires can be driven at least 35,000 miles before wearing out. To determine the average number of miles that can be obtained from the manufacturer’s tires, the agency randomly selects 60 tires from the manufacturer’s warehouse and places the tires on 15 cars driven by test drivers on a 2-mile oval track. The number of miles driven (in thousands of miles) until the tires are determined to be worn out is given in the following table. Car 1 2 3 4 5 6 7 8 9 10 11 12 13 14 15 n y s Miles Driven 25 27 35 42 28 37 40 31 29 33 30 26 31 28 30 15 31.47 5.04 a. Place a 99% confidence interval on the average number of miles driven, m, prior to the tires wearing out. b. Is there significant evidence (a 5 .01) that the manufacturer’s claim is false? What is the level of significance of your test? Interpret your findings.The state education commission wants to estimate the fraction of tenth grade students that have reading skills at or below the eighth grade level. Step 1 of 2: Suppose a sample of 333 tenth graders is drawn. Of the students sampled, 260 read above the eighth grade level. Using the data, estimate the proportion of tenth graders reading at or below the eighth grade level. Enter your answer as a fraction or a decimal number rounded to three decimal places. Step 2 of 2: Suppose a sample of 333 tenth graders is drawn. Of the students sampled, 260 read above the eighth grade level. Using the data, construct the 80% confidence interval for the population proportion of tenth graders reading at or below the eighth grade level. Round your answers to three decimal places.Suppose we observe 84 alcoholics with cirrhosis of the liver, of whom 29 have hepatomas—that is, liver-cell carcinoma. Suppose we know, based on a large sample, that the risk of hepatoma among alcoholics without cirrhosis of theliver is 24%. What is the smallest number of hepatomas that would have to be observed among the alcoholics with cirrhosis of the liver for the hepatoma experience in this group to differ from the hepatoma experience among alcoholics without cirrhosis of the liver? (Hint: Use a 5% probability of getting a result at least as extreme to denote differences betweenthe hepatoma experiences of the two groups.)
- A social worker in a certain city claimed that only 25% of the children between 19 and 35 months had not had all of their vaccines. You believe the percentage is higher. In order to test the social worker’s claim, you contact 145 families that have a child between 19 and 35 months and find that 44 of the children had not had all of their vaccines. Can the social worker’s claim be supported to a level of significance of α = .02, test the hypothesis.suppose a simple random sample of size n=1000 is obtained from a population whose size is n=2,000,000 and whose population specified characteristic is p=0.75. complete parts (a) and (b) and (c) (a) describe the sampling distribution of p^ (b) what is the probability of obtaining x=770 or more individuals with the characteristic (c) what is the probability of obtaining x=720 or fewer individuals with the characteristicsThe manufacturer of a sports car claims that the fuel injection system lasts at least 48 months before it needs to be replaced. A consumer group does not believe this claim. The consumer group believes that it must be less than 48 months. The consumer group tests th the manufacturer's claim by surveying a random sample of 15 sports car owners who had the fuel injection system replaced. The ages of sports cars at the time of replacement were (in months) as follows: Assume that that the age of sports cars at the time of replacement is normally distributed. 29 42 49 48 53 46 30 51 42 52 38 47 50 34 52 Read part-a through part-f of this question fully and do them please. In your answers, please keep the appropriate number of decimals as requested in each part of the question. A. Compute the mean and the standard deviation of the above sample data. Be sure to find the appropriate standard deviation for purposes of carrying out the hypothesis test of interest. a. Sample…
- The Record of a state-owned company indicated that of all vehicles undergoing emissions testing during the previous year , 70% passed on the first test. A random sample of 200 cars tested in the country durring the current year reveals that 62% passed the initial test. Does this dat asugget that the proportion for this country is less than the previous countrywide proportio ? Test the relevant hypothesis at the 5% level of significance. A) State the null and alternative hypotheses for the test B) What is the test statistics C) Calculate the value of the test Statistic for this test D) Determine the critical region(s) for this test E) State the conclusion of this test . Give a reason for your answerSimple random: Generating an interview list using a random number generator Stratified: randomly picking 2 employees from each of the departments/floors at the hospital. Cluster: randomly picking 3 departments/floors and using all the employees from those areas Systematic: walking down the halls and picking the employee in every-other room For example: Convenience: picking the first 10 employees to walk into the hospital. The convenience method is the least successful method of selecting a proper sample for a statistical study. However, in this situation we can say that using this method would allow us to complete our study quickly. A negative effect of using this method could be extreme bias of the responses. The first ten employees to enter the hospital may all be excited to get to their jobs and therefore have a high satisfaction level. Also, employees entering together may work in the same area of the hospital, therefore limiting the scope of the results to just one area…Your place of employment is trying to determine whether to allow its employees to work from home for2 days a week. Knowing that you’ve previously taken a statistics course, your boss asks you to “figure itout”. You create a survey to gauge employee interest in this area.1. Formerly, your place of employment has tried to give surveys to everyone, a census, but only a fewpeople responded to the email. Your new plan is to randomly choose some employees and administerthe survey yourself. You put everyone’s name on a numbered list and randomly choose numbers untilyou have your sample. What form of sampling is being described here?2. Suppose you want to estimate the percentage of employees who want to work from home. Doingsome research on the internet, you find a recent study that found that 72% of employees prefer a hybridremote-office model. Using that value as your sample proportion, ?̂, estimate how many people youwould need to survey in order to estimate the percentage in your company…