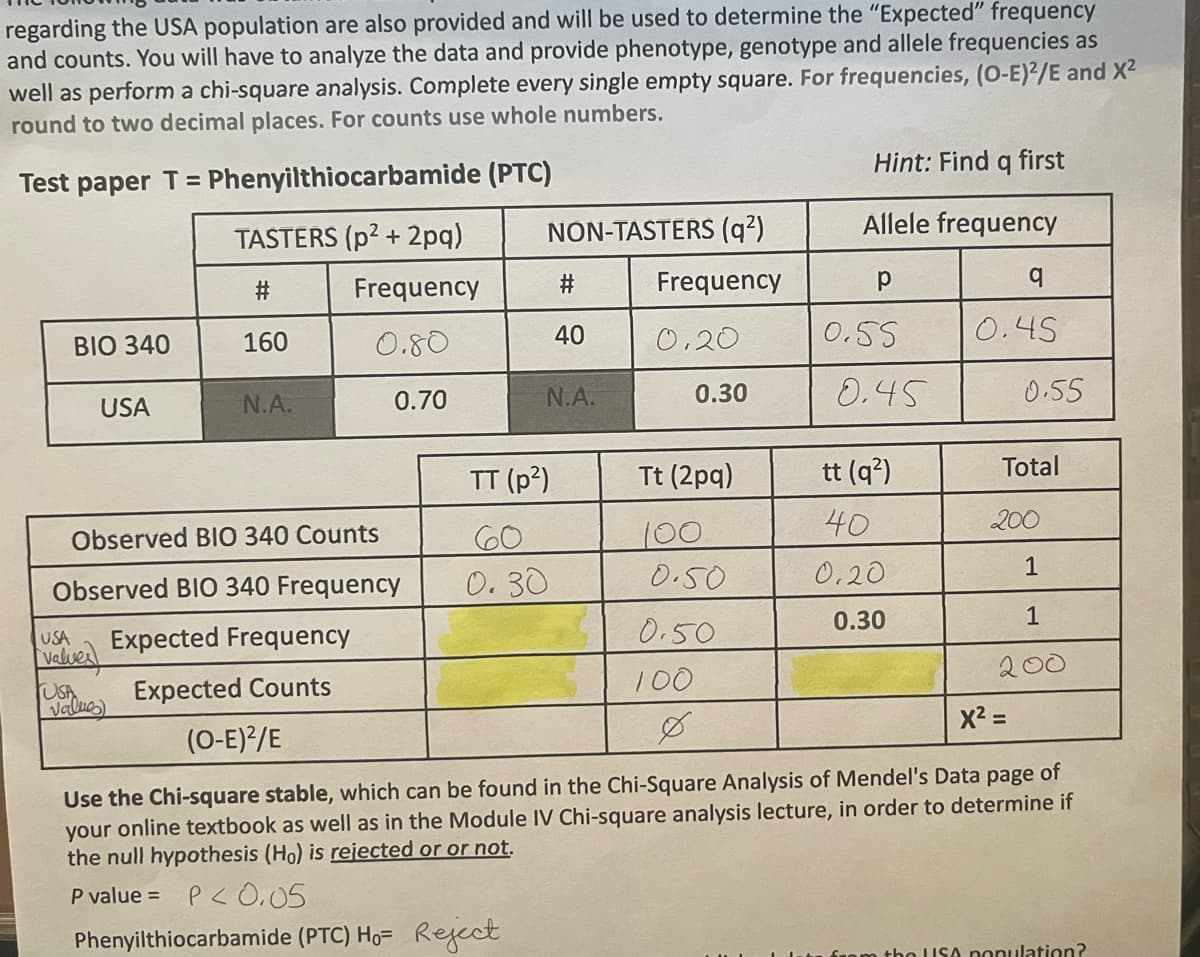
regarding the USA population are also provided and will be used to determine the "Expected" frequency and counts. You will have to analyze the data and provide phenotype, genotype and allele frequencies as well as perform a chi-square analysis. Complete every single empty square. For frequencies, (O-E)2/E and X² round to two decimal places. For counts use whole numbers. Test paper T = Phenyilthiocarbamide (PTC) BIO 340 USA USA valises TASTERS (p²+2pq) # Frequency 160 0.80 0.70 Observed BIO 340 Counts Observed BIO 340 Frequency N.A. USA (value) NON-TASTERS (q²) Frequency 0,20 # 40 N.A. TT (p²) 60 0.30 0.30 Tt (2pq) 100 0.50 0.50 100 Ø Hint: Find q first Allele frequency р 0.55 0.45 tt (q²) 40 0.20 0.30 q 0.45 0.55 Total 200 1 Expected Frequency Expected Counts x² = (O-E)2/E Use the Chi-square stable, which can be found in the Chi-Square Analysis of Mendel's Data page of your online textbook as well as in the Module IV Chi-square analysis lecture, in order to determine if the null hypothesis (Ho) is rejected or or not. P value = P<0.05 Phenyilthiocarbamide (PTC) Ho= Reject 1 200


Genetic Variation
Genetic variation refers to the variation in the genome sequences between individual organisms of a species. Individual differences or population differences can both be referred to as genetic variations. It is primarily caused by mutation, but other factors such as genetic drift and sexual reproduction also play a major role.
Quantitative Genetics
Quantitative genetics is the part of genetics that deals with the continuous trait, where the expression of various genes influences the phenotypes. Thus genes are expressed together to produce a trait with continuous variability. This is unlike the classical traits or qualitative traits, where each trait is controlled by the expression of a single or very few genes to produce a discontinuous variation.

Step by step
Solved in 3 steps


