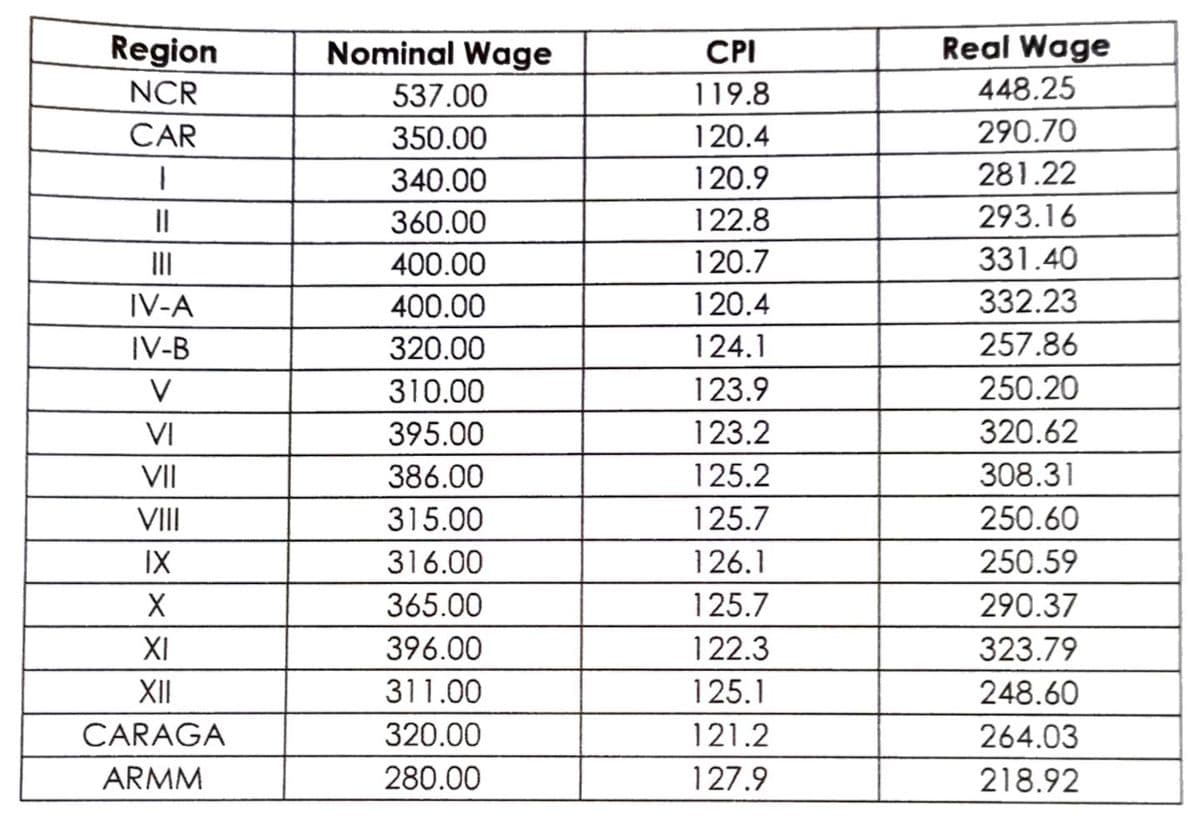
Region Nominal Wage CPI Real Wage NCR 537.00 119.8 448.25 CAR 350.00 120.4 290.70 340.00 120.9 281.22 II 360.00 122.8 293.16 II 400.00 120.7 331.40 IV-A 400.00 120.4 332.23 IV-B 320.00 124.1 257.86 V 310.00 123.9 250.20 VI 395.00 123.2 320.62 VII 386.00 125.2 308.31 VII 315.00 125.7 250.60 IX 316.00 126.1 250.59 365.00 125.7 290.37 XI 396.00 122.3 323.79 XII 311.00 125.1 248.60 CARAGA 320.00 121.2 264.03 ARMM 280.00 127.9 218.92


Q: Illustration 10.7. Compute the standard deviation by the short method for the following data: 11, 12...
A: Data given 11,12,13,14,15,16,17,18,19,20,21
Q: Show the complete solution. A university dean wishes to estimate the average number of hours his par...
A: Given that Population standard deviation =2.6 Margin of error =E =1 99% confidence.
Q: Calculate for the mean, MAD and MAD squared using the chart below. The data set below gives the wai...
A: Guven that, the data set below gives the waiting times (in minutes) of several people at a departmen...
Q: Answer the following problems with random samples taken from the normal population (The choices are...
A: Note: According to bartleby experts question answers guidelines an expert can solve only first quest...
Q: Listed below are the lead concentrations in µg/g measured in different traditional medicines. Use a ...
A:
Q: Exercise 1: Solving for X In 2021, the average SAT score for students in the freshman class of Nunya...
A: To find the x value using z- score, the formula is defined as shown below ...
Q: Professor Piraneo has three classes with 80 students total. He created a distribution for mid-term ...
A: a) The distribution for mid-term scores is given as, Score No. of students 90-100 12 ...
Q: what generation does this population reach its carrying capacity?
A: Here Given the logistic curve (Green Curve)
Q: Let X be a random variable with p.d.f f(x) x = 1,2,3, ... .Find the mode. 2,4 1,3 1,2 2,3
A:
Q: Let X be a random variable that represents the number of times an image (H) appears. Find average (M...
A: By observing the above problem, we easily see that the distribution of X follows a Binomial Distribu...
Q: a study of cell phone use and brain hemispheric dominance, an Internet survey was e-mailed to 5000 s...
A: Bootstrap confidence interval The bootstrap is a method for estimating standard errors and compu...
Q: . In a local election, voters are to select 6 councilors from the set candidates. If there are 12 ca...
A:
Q: Let, (4.00, 5.26, 4.84, 6.77, 5.23, 5.64, 3.84, 6.4, 3.35, 4.28) iid∼N(μ,σ2) with μ∈R and σ2 is unkn...
A: Given that data 4.00, 5.26, 4.84, 6.77, 5.23, 5.64, 3.84, 6.4, 3.35, 4.28 First I want to find mean...
Q: Below you see the item characteristic curves (ICCS) of 5 dichotomous math ability items (scored 0/1)...
A:
Q: Find the X-value (score) corresponding to each of the following Z-score.
A: Given the distribution whose mean is 50 and whose standard deviation is 8.
Q: Construct a frequency polygon and histogram for the following data. The score of students in a Geome...
A:
Q: You should be able to select the table and copy it directly to Excel or other such programs. 18.8 23...
A: 18.8,23.8,29.1,32.6,38.9,40.7,47.2,52.5,28,47.4,44.4,34.4,33,34,29.9,53.6,35.4,50,29.6,27.4,29.6,29....
Q: X1,X2,...,Xn are i.i.d. random variables from N(0,θ) distribution. Here, θ= σ2 >0 is the variance of...
A:
Q: Suppose that the sitting back-to-knee length for a group of adults has a normal distribution with a ...
A:
Q: You are a food researcher of GoFoods International, Ltd. You want to test the smell of your new and ...
A: The consideration we should make in choosing our panelists are i) Is the taste of new and improved k...
Q: The probability for winning a game of chance is 0.30. a. what is the probability for winning at lea...
A:
Q: Illustration 9.22. Calculate the GM of the data given in the first two columns Table 9.19.
A:
Q: PART II Identify a product available in your home. Measure the weight (g) or length (cm) of at least...
A: Hypothesis testing : Hypothesis testing is a type of statistical inference that uses sample data to ...
Q: The total compilation time of a computer program has Gamma distribution with average u=10 minutes an...
A: Mean=μ=10, Variance=σ2=50 Let X be the program
Q: 11 Construct a proportional stratified sample for the following situation: We are surveying undergra...
A: The proportion stratified sampling procedure is followed to obtain the required sample size of 1500 ...
Q: Answer the following problems with random samples taken from the normal population. (The choices ar...
A: Mean=μ=36.66, standard deviation=σ=3.57, n=200, P(x̄>a)=45% a=? Note: According to Bartleby gui...
Q: It takes an average of 8 minutes for blood to begin clotting after an injury. An EMT wants to see if...
A: Given The data is as follows: Pop. mean, μ=8Sample size, n=62Sample mean, x¯=7.8Sample sd, s=2.3α=0....
Q: What is the value of the standardized test statistic? The standardized test statistic is. (Round to ...
A:
Q: A study was conducted by Grade 11 STEM students to investigate the health hazards of working long ho...
A: Any assumption about the parameter or probability function is known as hypothesis testing. Given inf...
Q: Describe what participation bias is and how it affects the results of a study. Give an example. O Tr...
A: During the process of data collection for a research, there can be multiple ways a researcher can in...
Q: Liza wanted to help her family earn money in this time of pandemic. She decided to sell facemasks on...
A:
Q: if Y1 and Y2 are independent Poisson random variable with parameters λ1 and λ2 re- spectively. Then...
A:
Q: Sketch the area under the standard normal curve over the indicated interval and find the specific ar...
A:
Q: 63. Is there enough evidence to reject the claim at a = 0.10? Complete parts (a) through (e) below. ...
A:
Q: Illustration 9.22. Calculate the GM of the data given in the first two columns Table 9.19.
A:
Q: Find the critical value(s) and rejection region(s) for the indicated t-test, level of significance a...
A:
Q: Consider a data set where each observation involves counting the number of successes from an observe...
A: The possible remedies for the following problem is including additional explanatory terms in the mod...
Q: Part 4 of 5 (d) Would it be unusual if the the sample mean were greater than 529? Round answer to at...
A: Given that. X~N( μ , ?^2 ) μ=529 , ?=117 n=68 Z-score =( x - μ )/?
Q: Can the normal distribution be used to approximate this probability? A. Yes, the normal distribution...
A: Given X=40, n=58, p=0.5
Q: In a survey of women in a certain country (ages 20 - 29), the mean height was 62.6 inches with (a) W...
A:
Q: Question 5. In a recent BMO survey, many Canadian university students said they expected $26, 500 af...
A: The random variable X follows normal distribution. We have to construct 98% confidence interval for ...
Q: A secretary types five letters and the five corresponding envelopes. In a hurry, they place at rand...
A: Given that A secretary types five letters and the five corresponding envelopes. In a hurry, they p...
Q: integers x and y are relatively prime if their only common positive divisor is 1. Suppose we select ...
A: Given: Total number = 1 to 315 (315)
Q: A consumer group claims that the mean minimum time it takes for a sedan to travel a quarter mile is ...
A:
Q: Suppose you are the manager of Speedy Olil Change. You think your branch is very quick with oil chan...
A:
Q: Assume that adults have IQ scores that are normally distributed with a mean of 95.1 and a standard d...
A:
Q: DECIMAL FORM: 15 17 18 19 20 21 22 23 24 P(X) 0.03 0.09 0.18 0.18 0.15 0.26 0.6 0.03 0.03
A: Formula used. E(x)= ∑x×p(x) E(x2 )=∑x2 ×p(x) Var(x)=E(x2 ) - [E(x)]2
Q: A researcher wants to investigate the effects of environmental factors on IQ scores. For an initial ...
A:
Q: How many polygons can be possibly formed from 8 distinct points in which no three of which are colli...
A:
Q: Gold Silver Boys Girls 3 6. 9. A student is randomly selected. Find the probability (in exact fracti...
A: Gold Silver Bronze Total Boys 3 7 5 15 Girls 6 2 9 17 Total 9 9 14 32
Find the sample standard deviation of the nominal wage and real wage,
respectively.
A. 3543.24;2759.38
B. 57.75; 50.96
C. 59.53; 52.53
D. 3334.81; 2597.06

Step by step
Solved in 3 steps with 4 images

- Two different types of injection-moulding machines are used to form plastic parts. A part is considered defective if it has excessive shrinkage or is discoloured. Two random samples, each of size 300, are selected, and 13 defective parts are found in the sample from machine 1, and 8 defective parts are found in the sample from machine 2. Is it reasonable to conclude that both machines produce the same fraction of defective parts, using α = 0.05, find the value of zcalc? Please report your answer upto 2 decimal places.A consumer-testing agency wants to evaluate the claim made by a manufacturer of discount tires. The manufacturer claims that its tires can be driven at least 35,000 miles before wearing out. To determine the average number of miles that can be obtained from the manufacturer’s tires, the agency randomly selects 60 tires from the manufacturer’s warehouse and places the tires on 15 cars driven by test drivers on a 2-mile oval track. The number of miles driven (in thousands of miles) until the tires are determined to be worn out is given in the following table. Car Miles Driven 1 25 2 27 3 35 4 42 5 28 6 37 7 40 8 31 9 29 10 33 11 30 12 26 13 31 14 28 15 30 Average 31.47 Standard 5.04 Agency would like to know if the manufacturer’s claim is false. Carryout an appropriate hypothesis test (use 1% significance level). Check any assumptions you think are relevant before doing the text.The reputation (and hence, sales) of many businesses can be severely damaged by shipments of manufactured items that contain an unusually large percentage of defectives. For example, a manufacturer of flashbulbs for cameras may want to be reasonably certain that less than 5% of the bulbs are defective. Suppose 300 bulbs are randomly selected from a very large shipment, each is tested, and 10 defective bulbs are found. Does this provide sufficient evidence for the manufacturer to conclude that the fraction defective in the entire shipment is less than 0.05? Use =0.01. A B x1=365 x2=352 s1=23 s2=41
- A consumer testing agency wants to evaluate the claim made by a manufacturer of discount tires. The manufacturer claims that its tires can be driven at least 35,000 miles before wearing out. To determine the average number of miles that can be obtained from the manufacturer’s tires, the agency randomly selects 60 tires from the manufacturer’s warehouse and places the tires on 15 cars driven by test drivers on a 2-mile oval track. The number of miles driven (in thousands of miles) until the tires are determined to be worn out is given in the following table. Car 1 2 3 4 5 6 7 8 9 10 11 12 13 14 15 n y s Miles Driven 25 27 35 42 28 37 40 31 29 33 30 26 31 28 30 15 31.47 5.04 a. Place a 99% confidence interval on the average number of miles driven, m, prior to the tires wearing out. b. Is there significant evidence (a 5 .01) that the manufacturer’s claim is false? What is the level of significance of your test? Interpret your findings.The state education commission wants to estimate the fraction of tenth grade students that have reading skills at or below the eighth grade level. Step 1 of 2: Suppose a sample of 333 tenth graders is drawn. Of the students sampled, 260 read above the eighth grade level. Using the data, estimate the proportion of tenth graders reading at or below the eighth grade level. Enter your answer as a fraction or a decimal number rounded to three decimal places. Step 2 of 2: Suppose a sample of 333 tenth graders is drawn. Of the students sampled, 260 read above the eighth grade level. Using the data, construct the 80% confidence interval for the population proportion of tenth graders reading at or below the eighth grade level. Round your answers to three decimal places.Suppose we observe 84 alcoholics with cirrhosis of the liver, of whom 29 have hepatomas—that is, liver-cell carcinoma. Suppose we know, based on a large sample, that the risk of hepatoma among alcoholics without cirrhosis of theliver is 24%. What is the smallest number of hepatomas that would have to be observed among the alcoholics with cirrhosis of the liver for the hepatoma experience in this group to differ from the hepatoma experience among alcoholics without cirrhosis of the liver? (Hint: Use a 5% probability of getting a result at least as extreme to denote differences betweenthe hepatoma experiences of the two groups.)
- A social worker in a certain city claimed that only 25% of the children between 19 and 35 months had not had all of their vaccines. You believe the percentage is higher. In order to test the social worker’s claim, you contact 145 families that have a child between 19 and 35 months and find that 44 of the children had not had all of their vaccines. Can the social worker’s claim be supported to a level of significance of α = .02, test the hypothesis.suppose a simple random sample of size n=1000 is obtained from a population whose size is n=2,000,000 and whose population specified characteristic is p=0.75. complete parts (a) and (b) and (c) (a) describe the sampling distribution of p^ (b) what is the probability of obtaining x=770 or more individuals with the characteristic (c) what is the probability of obtaining x=720 or fewer individuals with the characteristicsThe manufacturer of a sports car claims that the fuel injection system lasts at least 48 months before it needs to be replaced. A consumer group does not believe this claim. The consumer group believes that it must be less than 48 months. The consumer group tests th the manufacturer's claim by surveying a random sample of 15 sports car owners who had the fuel injection system replaced. The ages of sports cars at the time of replacement were (in months) as follows: Assume that that the age of sports cars at the time of replacement is normally distributed. 29 42 49 48 53 46 30 51 42 52 38 47 50 34 52 Read part-a through part-f of this question fully and do them please. In your answers, please keep the appropriate number of decimals as requested in each part of the question. A. Compute the mean and the standard deviation of the above sample data. Be sure to find the appropriate standard deviation for purposes of carrying out the hypothesis test of interest. a. Sample…
- The Record of a state-owned company indicated that of all vehicles undergoing emissions testing during the previous year , 70% passed on the first test. A random sample of 200 cars tested in the country durring the current year reveals that 62% passed the initial test. Does this dat asugget that the proportion for this country is less than the previous countrywide proportio ? Test the relevant hypothesis at the 5% level of significance. A) State the null and alternative hypotheses for the test B) What is the test statistics C) Calculate the value of the test Statistic for this test D) Determine the critical region(s) for this test E) State the conclusion of this test . Give a reason for your answerSimple random: Generating an interview list using a random number generator Stratified: randomly picking 2 employees from each of the departments/floors at the hospital. Cluster: randomly picking 3 departments/floors and using all the employees from those areas Systematic: walking down the halls and picking the employee in every-other room For example: Convenience: picking the first 10 employees to walk into the hospital. The convenience method is the least successful method of selecting a proper sample for a statistical study. However, in this situation we can say that using this method would allow us to complete our study quickly. A negative effect of using this method could be extreme bias of the responses. The first ten employees to enter the hospital may all be excited to get to their jobs and therefore have a high satisfaction level. Also, employees entering together may work in the same area of the hospital, therefore limiting the scope of the results to just one area…Your place of employment is trying to determine whether to allow its employees to work from home for2 days a week. Knowing that you’ve previously taken a statistics course, your boss asks you to “figure itout”. You create a survey to gauge employee interest in this area.1. Formerly, your place of employment has tried to give surveys to everyone, a census, but only a fewpeople responded to the email. Your new plan is to randomly choose some employees and administerthe survey yourself. You put everyone’s name on a numbered list and randomly choose numbers untilyou have your sample. What form of sampling is being described here?2. Suppose you want to estimate the percentage of employees who want to work from home. Doingsome research on the internet, you find a recent study that found that 72% of employees prefer a hybridremote-office model. Using that value as your sample proportion, ?̂, estimate how many people youwould need to survey in order to estimate the percentage in your company…