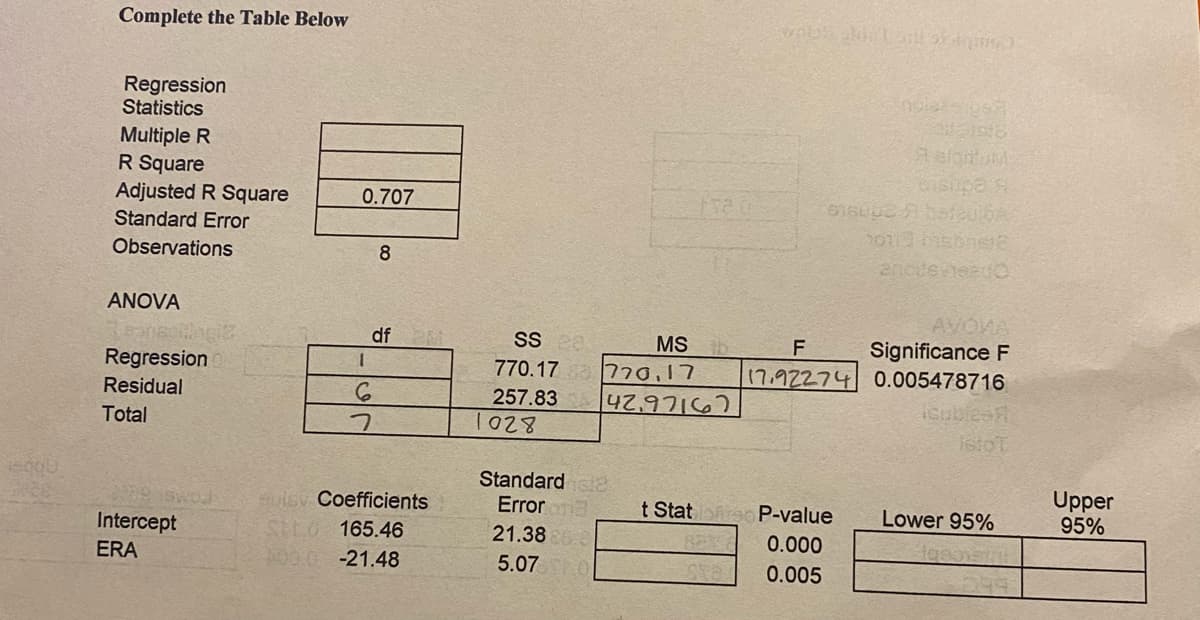
Regression Statistics Multiple R R Square Adjusted R Square 0.707 Standard Error Observations ANOVA SS ee 770.17 7 .17 MSb Significance F 17.92274 0.005478716 icublesR fetoT df Regression Residual 257.83 Total Standard e Upper 95% Suisy Coefficients SHEO 165.46 2000 -21.48 Error t Statoreo P-value Lower 95% Intercept 21.3860 5.07 O 0.000 ERA 0.005


Q: Fry Brothers Heating and Air Conditioning, Inc. employs Larry Clark and George Murnen to make servic...
A: Given : Claim : there a difference in the mean number of calls per day between the two employees
Q: Use the table to find the probabilities for a juice chosen from the shelf at random. P(less than 40...
A:
Q: If you roll two six-faced dice together, you will get 36 possible outcomes. 1. List all possible out...
A: When we rolled two six faced dice. So total no. of possible outcomes will be 6^2=36. 1) These are [ ...
Q: Create a 95% confidence interval for the proportion of U.S. adults who live with one or more chronic...
A: Here Given proportion of Us adults report that they live with one more chronic conditions=P¯=0.45 St...
Q: (c) Find the probability that 8 or more of the flights were on time. The probability that 8 or more ...
A: Let p be the probability that a flight is on time. Given that p = 0.85 Let X denote the number of fl...
Q: Answer the following statistic questions. What is the difference between sigma (o) and s? What needs...
A: Sigma represents populations standard deviation derived from a infinite number of measurements, wher...
Q: Suppose the reaction temperature X (in °C) in a certain chemical process has a uniform distribution ...
A: As per our guidelines we are supposed to answer only 3 sub-parts (if there are multiple sub-parts as...
Q: The mean number of hours of sleep that a college student gets per night is 6 hours with a standard d...
A: We have given that. X~N( μ , ?^2 ) μ=6 , ? =3 , n=40 Z-score =( x - μ )/?
Q: Use the empirical distribution function interpolation method to compute the 100 percentile for the f...
A: First we arrange the data in ascending order so it would be easy to get 100th percentile, Data in as...
Q: Find out the variance of the following series : Income No. of Persons More than 1000 50 More than 90...
A:
Q: There are 16 components in a non-redundant system. The average reliability of each component is 0.99...
A:
Q: The following are some of the particulars of the distribution of weight of boys and girls in a class...
A:
Q: The following frequency distribution shows the number of crimes committed in a sample of 100 urban n...
A: We have given that, Number of crimes of Neighborhoods Frequency (f) 0-9 10 10-19 20 20-...
Q: Here are measurements (in millimeters) of a critical dimension on an SRS of 8 of the more than 200 a...
A:
Q: Suppose the reaction temperature X (in °C) in a certain chemical process has a uniform distribution ...
A:
Q: Sammy's Salsa, a small local company, produces 20 cases of salsa a day. Each case contains 12 jars a...
A:
Q: If X is a uniform random variable in (-2 , 4) and Y = X² – 4, the probability density function g() o...
A: Probability density function : A probability density function, also known as the density of a contin...
Q: c) Assume this is a simple random sample of U.S. women. Use the Empirical Method to estimate the pro...
A: Given that: X represents no. Of children f represents no. Of women A frequency table is given by u...
Q: (c) Find the probability that all four tires have low air pressure. The probability that all four ti...
A: Here given probability distribution of X X = no of tire with low air pressure
Q: dults Conducted by the Financial Industry ts Conducted by the Financial Tndustey Pegulatory Authonit...
A: We have given that Sample size n =1118 Favorable cases x =626 Sample proportion p^=x/n =626/1118 =...
Q: 0 1 2 3 4 S 6 7 8 9 10 11 12 Year Determine the equation of the line of best fit. Question 19 option...
A:
Q: Need an example of multiple linear regression
A: Multiple linear regression is where more than one independent value, meaning that we try to predict ...
Q: (b) What is the probability than an asthma patient is less than 1 year old? The probability that an ...
A: b) The number of asthma patient is less than 1 year old is 7870.
Q: What is z* for a 92% confidence level?
A: To find value of Z* for a 92% confidence level ??
Q: 3- Calculated the expected variances (o ) for each.
A: From the given information 3. i j to ti tp σ2=(tp-to6)2 1 2 1 1 7 σ2=(7-16)2=1 1 3 1 4 7 σ2...
Q: The mean number of hours of sleep that a college student gets per night is 6 hours with a standard d...
A: Given data,Mean μ=6sd σ=3n=20P(X<5)=?
Q: Mean= 100 and standard deviation=10, what is probability of x110
A:
Q: Ten samples each of size 5 are drawn at reqular intervals from a manufacturing process. The sample m...
A:
Q: Example 42. The mean and standard deviation of 20 items was found Later, it was found that item 12 w...
A:
Q: Given the interval (112, 136), what is the point estimate? 12 a 115 124 24
A:
Q: Given the confidence interval (22.5, 67.3), what is the margin of error? 44.9 a 11.2 22.4 d 44.8
A:
Q: How many different sets of three candies can you select?
A: A candy jar has 10 different candies in it three candies are selected from jar
Q: Perform a statistical test for the given problem. Follow the steps in hypothesis testing when you pr...
A: Given: Without Treatment With Treatment 1.8 3.9 2.9 4.8 3.3 4.7 3.1 4.9 2.4 4.2 1.5 4...
Q: Below is bivariate data on vintage dresser auctions, where X is the year of construction of the dres...
A: For the given data Find Correlation ,regression line
Q: Do you find any association between the temperaments of brothers and sisters from the following data...
A: We need to test if there is any association between temperaments of brothers and sisters.
Q: Given the confidence interval (0.53, 0.61), what is the width? 0.16 a b 0.04 0.08 d 0.02
A:
Q: Consider the following correlations -0.9 , -0.5 , -0.2 , 0 , 0.2 , 0.5 and 0.9. For each give the f...
A: Given, the correlations -0.9 , -0.5 , -0.2 , 0 , 0.2 , 0.5 and 0.9. We need to calculate the fracti...
Q: Why is the null hypothesis for regression usually B- 0?
A: The regression analyzes the relationship between the predictor or independent variable and the depen...
Q: Suppose we know that the mean score among the population of college students taking the GMAT test is...
A: given;X: the score among the population of college students taking the GMAT testpopulation mean(μ)=1...
Q: 3. ABC hospital with branches in lloilo City and in Bacolod City has developed an improved process f...
A:
Q: In the Standard Normal distribution of Z, Z ~ N(0,1), find the Z value Zo.025 such that Pr(Z<Zo.025)...
A: Given that Z follows standard normal distribution with mean =zero and standard deviation =1 Z~N(μ= ...
Q: Do you find any association between the temperaments of brothers and sisters from the following data...
A:
Q: 8) On a certain campus (assume it is a large university), people of color make up 20% of the student...
A: According our policy we can answer only first three subpart for remaining please repost the question...
Q: The following frequency distribution shows the number of crimes committed in a sample of 100 urban n...
A: Given : Number of crimes Frequency of Neighborhoods ...
Q: The cost of living index number on a certain date was 200. From the base period, the percentage incr...
A: Solution is given:
Q: In a regression problem, the following pairs of (x, y) are given: (3, 1), (3, –1), (3, 0), (3, –2), ...
A: The regression equation is used to relate the dependent variable with independent variable. The leas...
Q: An article in Fire Technology investigated two different foam expanding agents that can be used in t...
A: For the given data Find 95% C.I for sigma1^2/sigma2^2
Q: The heights of young American women, in inches, are approximately Normally distributed with mean µan...
A: Given,standard deviation(σ)=2.4margin of error(E)=1α=1-0.99=0.01α2=0.005Z0.005=2.58 (from Z-table...
Q: The mean and standard deviation of 200 items are found to be 60 and 20 respectively. If at the time ...
A:
Q: Cost of health care: The following table presents the mean cost of a hospital stay, in $1000, and th...
A: From the given information the graph shows the mean cost of a hospital stay, $1000. The number of ho...


Trending now
This is a popular solution!

Step by step
Solved in 5 steps with 1 images

- For unemployed persons in the United States, the average number of months ofunemployment at the end of December 2009 was approximately seven months(Bureau of Labor Statistics, January 2010). Suppose the following data are for aparticular region in upstate New York. The values in the first column show thenumber of months unemployed and the values in the second column show thecorresponding number of unemployed persons.MonthsUnemployedNumberUnemployed1 10292 16863 22694 26755 34876 46527 41458 35879 2325 10 1120Let x be a random variable indicating the number of months a person is unemployed.a. Use the data to develop an empirical discrete probability distribution for x.b. Show that your probability distribution satisfies the conditions for a validdiscrete probability distribution.c. What is the probability that a person is unemployed for two months or less?Unemployed for more than two months?d. What is the probability that a person is unemployed for more than sixmonths?The following data has been collected on the interarrival times of patients to an emergency department: 3.772, 1.761, 0.743, 15.988, 0.412, 7.541, 6.900, 3.447, 7.024, 1.061, 5.449, 0.309, 0.766, 4.807, 8.143, 0.093, 9.524, 0.012, 4.634, and 0.195 minutes. Estimate the squared coefficient of variation of the arrival process. Is the arrival process likely to be Poisson? Why or why not? Estimate the arrival rate?A lecturer at WIN wanted to know if he can predict student’s quiz results by asking them tocomplete a simple survey. The result of the survey is found in the file: Assignment 2 sem22020data set 1. Quiz Results EQR Study Hrs Age Sex BBT MB MC AuHS LM 15 10 3 19 0 0 1 1 0 1 14 15 4 24 0 0 1 0 0 1 9 15 1 20 0 10 1 0 0 1 6 10 3 21 0 0 1 1 0 1 14 15 4 21 0 9 1 0 0 1 12 10 6 21 0 2 0 1 0 1 12 13 2 21 1 8 1 0 0 0 15 15 0 20 0 8 1 0 0 1 12 15 3 20 0 10 1 0 0 1 13 15 0.2 19 0 8 1 0 0 1 15 15 2 20 0 6 1 0 1 1 12 14 5 20 0 5 1 1 1 1 14 15 7 22 0 8 0 0 0 0 7 7 10 21 1 7 0 0 1 0 11 15 5 24 0 0 1 0 0 1 10 10 3 22 1 0 1 0 0 1 13 11 3 23 1 1 1 1 1 1 13 15 2 22 1 8 0 0 0 0 13 12 4 20 1 7 1 0 1 0 13 10 3 20 1 0 1 0 0 1 8 13 5 20 1 8 0 0 0 0 12 13 5 22 0 5 0 0 0 1 13 15 8 22 0 5 0 1 0 1 10 13 4 23 1 7 1 0 0 1 13 13 0.5 20 1 0 0 0 0 0 12 13 0.5 20 1 0 1 0 0 0 15 15 2 21 0 10 1 0 0 1 10 13 6 22 0 6 1 1 0 1 11 8 5 20 0 10 0 0 1 0 12 10 4 19 1…
- Is the number of square feet of living space a good predictor of a house’s selling price? The following data collected in April, 2015, show the square footage and selling price for fifteen houses in Winston Salem, North Carolina. Size (1000s sq. ft) Selling Price ($1000s) 1.26 117.5 3.02 299.9 1.99 139.0 0.91 45.6 1.87 129.9 2.63 274.9 2.60 259.9 2.27 177.0 2.30 175.0 2.08 189.9 1.12 95.0 1.38 82.1 1.80 169.0 1.57 96.5 1.45 114.9 Develop a scatter diagram with square feet of living space as the independent variable and selling price as the dependent variable. What does the scatter diagram indicate about the relationship between the size of a house and the selling price? a. Develop the estimated regression equation that could be used to predict the selling price given the number of square feet of living space. Please do not hand write. thank you.Kaitlyn measures the upload speed in megabits per second of her home broadband internet connection during peak hours and off-peak hours. The results are provided in the accompanying table. Peak Off-Peak 5.83 5.14 6.05 6.80 7.14 6.98 3.54 5.77 5.45 7.27 5.90 6.62 5.81 6.19 4.82 6.08 6.37 6.59 4.65 5.58 5.30 7.41 6.48 6.26 5.96 6.37 5.79 6.31 6.84 6.55 5.06 4.95 5.61 7.03 6.45 6.77 Examine the results of Kaitlyn's test to determine the statements that compare the medians and interquartile ranges of the data sets to each other in terms of this situation. Select the two correct answers. The median upload speed during peak hours is 5.905 megabits per second, which is less than the median upload speed during off-peak hours, 7.005 megabits per second. The upload speeds during peak hours are slower on average compared to off-peak times. The median upload speed during peak hours is 6.37 megabits per second, which is greater than the median upload speed during…An agent for a property management company would like to be able to predict the monthly rental cost for apartments based on the size of the apartment as defined by square footage. A sample of the rent of 25 apartments in a college rental neighborhood was selected, and the information collected revealed the following: Apartment Size (Sq. Ft.) Monthly Rent ($) 1 850 950 2 1,450 1,600 3 1,085 1,200 4 1,232 1,500 5 718 950 6 1,485 1,700 7 1,136 1,650 8 726 935 9 700 875 10 956 1,150 11 1,100 1,400 12 1,285 1,650 13 1,985 2,300 14 1,369 1,800 15 1,175 1,400 16 1,225 1,450 17 1,245 1,100 18 1,259 1,700 19 1,150 1,200 20 896 1,150 21 1,361 1,600 22 1,040 1,650 23 755 1,200 24 1,000 800 25 1,200 1,750 e) Determine the coefficient of determination r2 and then completely interpret…
- An agent for a property management company would like to be able to predict the monthly rental cost for apartments based on the size of the apartment as defined by square footage. A sample of the rent of 25 apartments in a college rental neighborhood was selected, and the information collected revealed the following: Apartment Size (Sq. Ft.) Monthly Rent ($) 1 850 950 2 1,450 1,600 3 1,085 1,200 4 1,232 1,500 5 718 950 6 1,485 1,700 7 1,136 1,650 8 726 935 9 700 875 10 956 1,150 11 1,100 1,400 12 1,285 1,650 13 1,985 2,300 14 1,369 1,800 15 1,175 1,400 16 1,225 1,450 17 1,245 1,100 18 1,259 1,700 19 1,150 1,200 20 896 1,150 21 1,361 1,600 22 1,040 1,650 23 755 1,200 24 1,000 800 25 1,200 1,750 i) Determine a 95% interval estimate for the average rent of apartments with 1000…An automobile dealer conducted a test to determine if the time in minutes needed to complete a minor engine tune-up depends on whether a computerized engine analyzer or an electronic analyzer is used. Because tune-up time varies among compact, intermediate, and full-sized cars, the three types of cars were used as blocks in the experiment. The data obtained follow. Analyzer Computerized Electronic Car Compact 49 41 Intermediate 55 44 Full-sized 64 47 Use ? = 0.05 to test for any significant differences. Find the value of the test statistic. (Round your answer to two decimal places.) Find the p-value. (Round your answer to three decimal places.) p-value =In 1998, as an advertising campaign, the Nabisco Company announced a "1000 Chips Challenge," claiming that every 18-ounce bag of their Chips Ahoy cookies contained at least 1000 chocolate chips. Dedicated statistics students at the Air Force Academy (no kidding) purchased some randomly selected bags of cookies and counted the chocolate chips. Some of their data are given below.1219 1214 1087 1200 1419 1121 1325 1345 1244 1258 1356 1132 1191 1270 1295 1135Find a 95% confidence interval for the mean number of chips in a bag of Chips Ahoy Cookies.
- You work for an insurance company and are studying the relationship between types of crashes and the vehicles involved. As part of your study, you randomly select 3632 vehicle crashes and organize the resulting data as shown in the contigency table. At α=0.01, can you conclude that the type of crash depends on the type of vehicle? Complete parts (a) through (d). Vehicle Type of crash Car Pickup Sport utility Single-vehicle 876 393 342 Multiple-vehicle 1143 475 403 Question content area bottom Part 1 (a) Identify the claim and state the null and alternative hypotheses. H0: The type of crash and the type of vehicle are . Ha: The type of crash and the type of vehicle are . (a) Identify the claim and state the null and alternative hypotheses. H0: The type of crash and the type of vehicle are Ha: The type of crash and the type of vehicle are . The alternative hypothesis is the claim. Part 2 (b) Determine the degrees of…An automobile dealer conducted a test to determine if the time in minutes needed to complete a minor engine tune-up depends on whether a computerized engine analyzer or an electronic analyzer is used. Because tune-up time varies among compact, intermediate, and full-sized cars, the three types of cars were used as blocks in the experiment. The data obtained follow. Analyzer Computerized Electronic Car Compact 51 42 Intermediate 55 43 Full-sized 62 47 Use ? = 0.05 to test for any significant differences. State the null and alternative hypotheses. H0: ?Computerized ≠ ?ElectronicHa: ?Computerized = ?ElectronicH0: ?Computerized = ?Electronic = ?Compact = ?Intermediate = ?Full-sizedHa: Not all the population means are equal. H0: ?Computerized = ?ElectronicHa: ?Computerized ≠ ?ElectronicH0: ?Compact ≠ ?Intermediate ≠ ?Full-sizedHa: ?Compact = ?Intermediate = ?Full-sizedH0: ?Compact = ?Intermediate = ?Full-sizedHa: ?Compact ≠ ?Intermediate ≠ ?Full-sized Find the value of…If a researcher wants to find out the average monthly expenses of all university students in Edmonton, this average would be an example of ________ . a. samplecross out b. statisticcross out c. populationcross out d. parameter