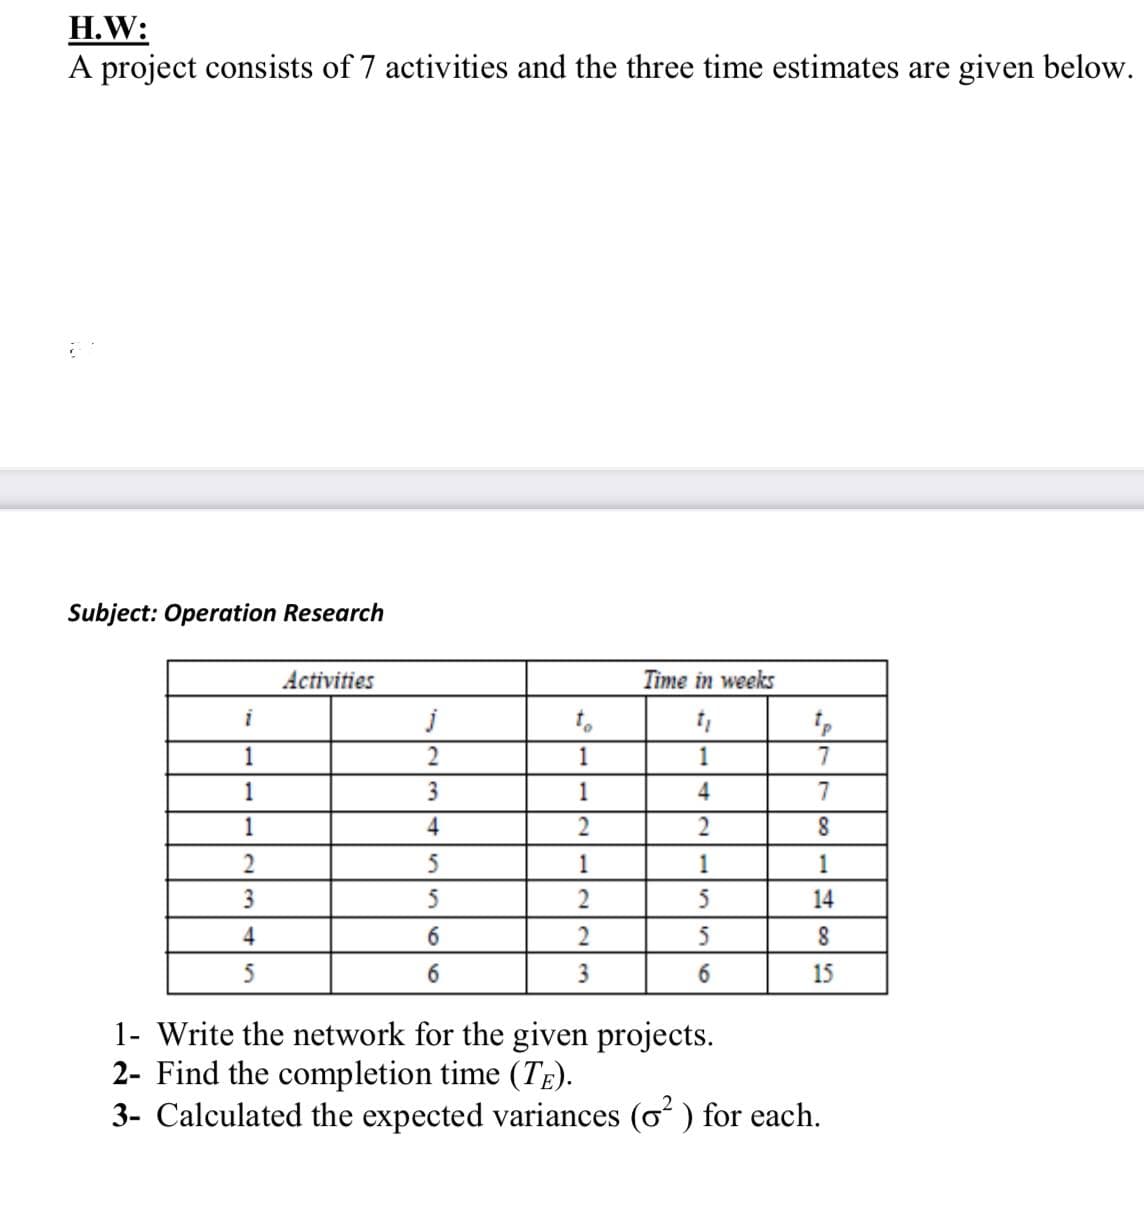
3- Calculated the expected variances (o ) for each.


Q: The prime Minister of a small Caribbean Island stated that 95% of the population was vaccinated from...
A: “Since you have posted a question with multiple sub-parts, we will solve first three sub-parts for y...
Q: Objective: Construct a probability distribution and use it to find the expected value of the game. I...
A: From the given information, There are two boxes with four balls each. Select one ball at random from...
Q: An incomplete distribution is given below: Variable Frequency Variable Frequency 10-20 12 50-60 20-3...
A: Solution is given: Both the parts are solved given:
Q: Derive the distribution of the sum of n independent random variables arch having the Poisson distrib...
A: Poisson distribution : The discrete probability distribution of the number of events happening in a ...
Q: 9. Mang Kiko, a banana plantation owner, plans to expand his banana business due to recent calamitie...
A:
Q: The joint probability distribution of the number X of cars and the number Y of buses per signal cycl...
A:
Q: received by a switchboard operator within a one-hour interval, X. X = x 1 2 3 4 5 6 P[X = x] 0.13 0....
A:
Q: Suppose that customers arrive at a bank according to a Poisson process with a mean rate of 3 per min...
A:
Q: Given the interval (112, 136), what is the point estimate? 12 a 115 124 24
A:
Q: What is the term free of ab in the expansion (Vab + Vab (c) 705,432 (a) 646,646 (b) 22P12 (d) 22P1
A:
Q: The following zero order correlation coefficients are given : r12 = 0.5 r13 = 0.6 r23 =.7 Calculate ...
A:
Q: What does it mean to say that the real-valued RVs X and Y are inde- pendent, and how, in terms of th...
A:
Q: (12) Consider x1. X2 Nu, 8), where we want to choose between the null and alternative hypotheses: Co...
A:
Q: (d) What is the probability that the total number of customers in the two lines is exactly four? At ...
A: here use given joint probability distribution table x1 = no of customers in line at express checko...
Q: The following data relate to the age of a group of Govt. employees. Calculate the arithmetic mean an...
A: Solution:
Q: Given the mean of 62 and the standard deviation 8, find the z-score that corresponds to each of the ...
A: Given: Mean = mu = 62 Standard deviation = sigma = 8 X = 78
Q: Suppose a 95% confidence interval for μ runs from 38 to 46. If we had tested H0: μ = 42 against H1:...
A: Given that,a 95% confidence interval for μ runs from 38 to 46. Then we need to find the decision if ...
Q: 36. Compute median from the following data: Mid-values 115 125 135 145 155 165 175 185 195 Frequency...
A: we want to compute median of given data mid points 115 125 135 145 155 16...
Q: What is the Bayes Factor for the association between gender and position type?
A: Given: The Bayesian model of gender and position from the summary of model to find Bays factor for ...
Q: Below is a graph of a normal distribution with mean u = 5 and standard deviation o = 3. The shaded r...
A:
Q: Allustration 45. Calculate the Seasonal Index from the following data using the average method: Year...
A:
Q: 2. The recommended price for 1 kilo of pork is Php 225 pesos. A researcher wants to know if a certai...
A: The hypothesized mean is 225 pesos.
Q: 1. increased from 50 to 200? 2. increased from 25 to 225? 3. increased from 200 to 400? 4. decreased...
A:
Q: Consider the random variable X that represents the number of people who are hospualized or died in a...
A:
Q: (Continuous series-exclusive). Find the median of the following distribution. Class intervals Freque...
A: Solution is given:
Q: 9
A:
Q: Calculate the median from the following data : Value Frequency Value Frequency Less than 10 4 Less t...
A: Solution is given:
Q: If T, is the RV denoting the time of occurrence of the nth event in a Poisson process with parameter...
A:
Q: In an international school, there are two foreign language courses, German and French. Each student ...
A:
Q: 2. A scrap metal dealer claims that the mean of his cash sales is "no more than $80," but an Interna...
A: Given that: Population mean(u) = $ 80 Sample mean = $ 91 SAMPLE standard deviation = $21 Sample size...
Q: lot of the data and graph the function on the same coordinate grid. Calculate the residuals and make...
A: Scatter Plot:
Q: A particular fruit's weights are normally distributed, with a mean of 635 grams and a standard devia...
A: Given.mean(μ)=635standard deviation(σ)=27
Q: The time until recharge for a battery in a laptop computer under common conditions is normally distr...
A:
Q: The following zero order correlation coefficients are given : "12= 0.5 "13 = 0.6 r23 =.7 Calculate t...
A: Given,r12=0.5 , r13=0.6 , r23=0.7
Q: An analysis of archaeological ruins at a site on the Greek island of Panarea recorded the total floo...
A:
Q: determine the area to the left of a, the area between a and b, and the area to the right of b.
A: Here use standard normal distribution table
Q: Example 5. For the following data, find the standard deviation and the co-efficient of variation. Ma...
A:
Q: In a conference, 3 Thai, 4 Japanese, and 2 Filipinos found themselves grouped together in a workshop...
A:
Q: Suppose X has a continuous uniform distribution over the interval -1,1. Determine the variance. Roun...
A: GivenX has a continuos uniform distribution over the interval (-1,1)The corresponding density functi...
Q: Consider a random sample X1,..., X, with n > 3 from the exponential distribution with parameter A > ...
A: Given fx; λ=1λe-x/λ, x>0. The two estimators of λ are: λ^=13∑i=13Xi, λ¯=nX1 EX=∫0∞x 1λe-...
Q: educational
A: Continuous data type: It's the type of Information that can be measured on a continuum or scale.
Q: which situation illustrates a permutation? a. selecting 5 questions to answer out of the 10 question...
A: Selecting 5 questions to answer out of the 10 questions in a test. Permutations means arrangement of...
Q: 3) Data were collected to explain the amount of a customer's purchase (expressed in $'s) bused on th...
A: The df of Regression is given by p which is equal to 1 here , since there is only one explanatory va...
Q: A crypto trader has been studying the performance of a coin and found out the coin's value on any gi...
A: Hello! As you have posted more than 3 sub parts, we are answering the first 3 sub-parts. In case yo...
Q: The number of accidents in a city follows a Poisson process with a mean of 2 per day and the number ...
A:
Q: A stady of the career plam of young womm and men set questionnares to all 722membes of the semier cl...
A: Introduction: It is of interest to test whether there is a significant relationship between the gend...
Q: Use the table to answer ITEMS 6 - 12. f 2 5 4 7 2 9 5 10 1 6. What is the probability of x = 7? 7. W...
A: For the given data find the given probabilties
Q: Consider a random sample X1,..., X, with n > 3 from the exponential distribution rith parameter A > ...
A: Given that, a random sample X1, X2.....Xn with n>3 is from the exponential distribution with para...
Q: 2. The recommended price for 1 kilo of pork is Php 225 pesos. A researcher wants to know if a certai...
A: According to the answering guidelines, we can answer only three subparts of a question and the rest ...
Q: Compute the geometric mean from the following data : Marks No. of students 0-10 10 10-20 5 20-30 8 3...
A:

Step by step
Solved in 2 steps

- A researcher obtains t(20) = 2.00 and MD = 9 for a repeated-measures study. If the researcher measures effect size using the percentage of variance accounted for, what value will be obtained for r2?A random sample of senior citizens living in a retirement village reported that they had an average of 1.42 face-to-face interactions per day with their neighbors. A random sample of those living in age-integrated communities reported 1.58 interactions per day. Is the difference between the two senior citizen groups significant? Please provide t critical, t obtained and your decision. Retirement Community 1 Retirement Community 2 Mean1 = 1.42 Mean2 = 1.58 s1 = 0.10 s2 = 0.78 N1 = 43 N2 = 37Consider an automatic production line that delivers computer components for inspection. According to the system’s specification, the interarrival time of the delivery follows a continuous uniform distribution between 5 to 15 minutes. The average inspection time of one component is 10 minutes. A simulation model was developed to replicate the system and eight samples were collected with the following data: Sample # 1 2 3 4 5 6 7 8 Interarrival time 14.7 14.8 6.8 11.6 6.3 13.3 7.9 10.3 Inspection time 8.3 5.7 4.0 9.0 10.6 5.9 8.5 7.0 Apply the Kolmogorov-Smirnov test, at the 1% level of significance, to test the hypothesis that the simulated interarrival times comply with the system’s specification. Conduct a statistical test to determine if the simulated inspection times are consistent with the system behavior at the 5% level of significance. Give another set of inspection times, 9.1, 12.7, 8.7, 10.8, 11.6, and 6.8,…
- The average UQ student reports dedicating 8.5 hours per week to each 2-unit course. What is the approximate t obtained value for a group of 16 psychology students who study for a mean of 9.5 hours per week for each 2-unit course, where the estimated population variance is 3.68. Would this sample be considered significantly different from the population, applying an alpha level of 0.05? t = 0.48; the sample would be considered statistically significant t = 0.48; the sample would NOT be considered statistically significant t = 2.08; the sample would NOT be considered statistically significant t = 2.08; the sample would be considered statistically significant3) A firm in Lebanon has developed a chemical solution that can be added to car gasolinewhich they believe will increase the miles per gallon that cars will get. The owners areinterested in estimating the difference between mean mpg for cars using the chemicalsolution versus those that are not using the solution. The following data represent the mpgfor independent random samples of cars from each population.with Solution without Solution______________________________n1 = 36 n2 = 42 x1 = 25.45 x2 = 24.1 _______________________________Assume that the populations are normally distributed and the population standarddeviations are known to be σ1 = 3.95 (with solution) and σ2 = 3.09 (without solution).Given this data, can the owners believe that there is a difference between mean mpg forcars using the chemical solution versus those that are not using the solution? Test using analpha level equal to 0.05.4) Given the following null and alternative hypothesis:H0: σ 2 ≤ 52HA : σ 2 > 52and the…Q.8.1 A large manufacturing company claims that more than 88% of its customers are fullysatisfied with the company’s products. Test this claim at the 5% significance level, if asurvey found that 360 out of a random sample of 400 of the company’s customerssaid that they were fully satisfied with the company’s products.Q.8.2 The CEO of Global Investment Funds claims that, on average, clients leave theirinvestment funds with the company for a period of at least 56 months.Test this claim at the 10% significance level, if it was found that a sample of 29 clientsleft their investment funds with the company for an average period of 58.85 months,with a standard deviation of 3.75 months.Q.8.3 A shop owner claims that on average, his shop has a daily turnover of R75 000. Testthis claim at the 5% significance level, if the average daily turnover for a sample of 88days was R71 500. Assume a population standard deviation of R4 450.
- The researchers reported:" A 2x2 ANOVA revealed, first of all, a main effect for depletion, indicating that depleted individuals generated less ideas (M = 9.40, SD = 5.64) than non-depleted individuals (M = 12.44, SD = 7.34), F (1, 108) = 6.03, p = .016, n2 = .05. This effect was qualified by the expected interaction with [perseverance], F (1,108) = 4.52, p = .036, n2 = .05". What size are the effects for the main effect of depletion and for the interaction between depletion and perseverance, according to Cohen's conventions? a. These are small- to -medium effects b. These are non existent effects c. These are large effects d. We are unable to tell from from the n2 / r2 statisticsA suburban hotel derives its revenue from its hotel and restaurant operations. Theowners are interested in the relationship between the number of rooms occupied on anightly basis and the revenue per day in the restaurant. Below is a sample of 25 days(Monday through Thursday) from last year showing the restaurant income and numberof rooms occupied.which of the following individuals is likely to be excluded from a clinical trial? a-individual with other diseases besides the disease of interest b-an individual whose data is considered to be an outlier c-an individual of who is considered to be a minority d-an individual who will have difficulty complying trial protocols.
- Miller (2008) examined the energy drink consumption of college undergraduates and found that female useenergy drinks significantly less often than males. To further investigate this phenomenon, suppose that a researcher selects a random sample of n = 36 male undergraduates and a sample of n = 25 females. On average, the males reported consuming M = 2.45 drinks per month and females had an average of M = 1.28. Assume that the overall level of consumption for college undergraduates averages mean = 1.85 energy drinks per month, and that the distribution of monthly consumption scores is approximately normal with a standard deviation is = 1.2. Use alpha =.01The final test and exam averages for 20 randomly selected students taking a course in engineering statistics and a course in operations research are in Table E11-7. Assume that the final averages are jointly normally distributed.You want to run a 2-tailed independent t-test on sample 1 (M = 24.3, SD = 1.6) and sample 2 (M = 27.5, SD = 1.8), which each have sample size = 5. You have set Alpha = 0.01. Assume equal variances and calculate t_obs.


