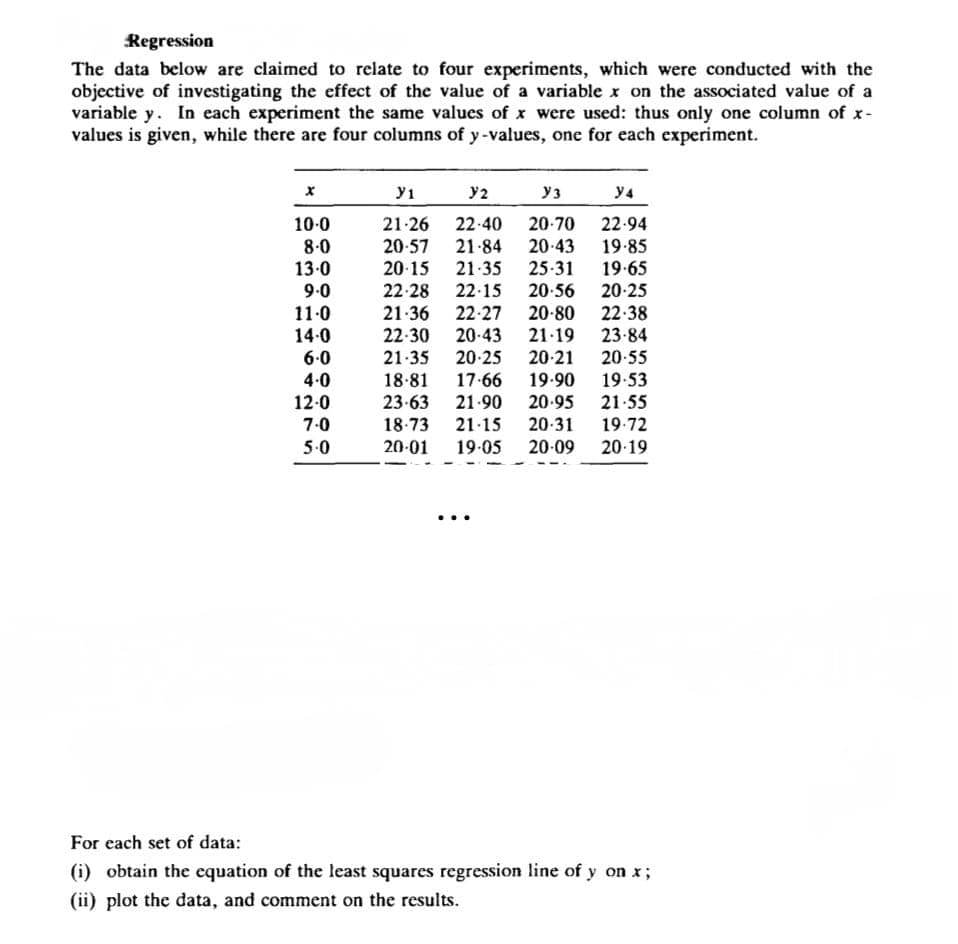
Regression The data below are claimed to relate to four experiments, which were conducted with the objective of investigating the effect of the value of a variable x on the associated value of a variable y. In each experiment the same values of x were used: thus only one column of x- values is given, while there are four columns of y-values, one for each experiment. X у1 Y2 Y3 y4 10-0 21-26 22.40 20-70 22.94 8.0 20-57 21-84 20-43 19-85 13.0 20-15 21-35 25-31 19-65 9.0 22-28 22.15 20-56 20-25 11.0 21-36 22-27 20-80 22.38 14-0 22.30 20-43 21-19 23-84 6.0 21-35 20-25 20-21 20-55 4-0 18-81 17.66 19.90 19.53 12-0 7-0 5.0 23-63 21-90 20-95 21-55 18-73 21.15 20-31 19-72 20-01 19.05 20-09 20-19 ... For each set of data: (i) obtain the equation of the least squares regression line of y on x; (ii) plot the data, and comment on the results.
Regression The data below are claimed to relate to four experiments, which were conducted with the objective of investigating the effect of the value of a variable x on the associated value of a variable y. In each experiment the same values of x were used: thus only one column of x- values is given, while there are four columns of y-values, one for each experiment. X у1 Y2 Y3 y4 10-0 21-26 22.40 20-70 22.94 8.0 20-57 21-84 20-43 19-85 13.0 20-15 21-35 25-31 19-65 9.0 22-28 22.15 20-56 20-25 11.0 21-36 22-27 20-80 22.38 14-0 22.30 20-43 21-19 23-84 6.0 21-35 20-25 20-21 20-55 4-0 18-81 17.66 19.90 19.53 12-0 7-0 5.0 23-63 21-90 20-95 21-55 18-73 21.15 20-31 19-72 20-01 19.05 20-09 20-19 ... For each set of data: (i) obtain the equation of the least squares regression line of y on x; (ii) plot the data, and comment on the results.

Elementary Linear Algebra (MindTap Course List)
8th Edition
ISBN:9781305658004
Author:Ron Larson
Publisher:Ron Larson
Chapter2: Matrices
Section2.CR: Review Exercises
Problem 89CR: Cellular Phone Subscribers The table shows the numbers of cellular phone subscribers y in millions...

Related questions
Question
Transcribed Image Text:Regression
The data below are claimed to relate to four experiments, which were conducted with the
objective of investigating the effect of the value of a variable x on the associated value of a
variable y. In each experiment the same values of x were used: thus only one column of x-
values is given, while there are four columns of y-values, one for each experiment.
X
y1
32
y3
y4
10.0
21-26
22.40
20-70
22.94
8.0
20-57
21-84 20-43
19-85
13.0
20-15 21-35
25-31
19.65
9.0
22-28 22.15 20-56
20-25
11-0
21.36 22-27
20-80
22-38
14.0
22.30 20-43 21.19 23-84
6.0
21-35 20-25 20-21
20-55
4.0
18.81 17-66
19.90
19.53
12-0
7-0
5.0
23-63 21.90 20-95 21.55
18.73 21.15 20-31 19.72
20-01 19-05 20-09 20-19
For each set of data:
(i) obtain the equation of the least squares regression line of y on x;
(ii) plot the data, and comment on the results.
Expert Solution
This question has been solved!
Explore an expertly crafted, step-by-step solution for a thorough understanding of key concepts.

Step by step
Solved in 3 steps with 3 images

Recommended textbooks for you
Elementary Linear Algebra (MindTap Course List)
Algebra
ISBN:
9781305658004
Author:
Ron Larson
Publisher:
Cengage Learning

Functions and Change: A Modeling Approach to Coll…
Algebra
ISBN:
9781337111348
Author:
Bruce Crauder, Benny Evans, Alan Noell
Publisher:
Cengage Learning

Algebra & Trigonometry with Analytic Geometry
Algebra
ISBN:
9781133382119
Author:
Swokowski
Publisher:
Cengage
Elementary Linear Algebra (MindTap Course List)
Algebra
ISBN:
9781305658004
Author:
Ron Larson
Publisher:
Cengage Learning
Functions and Change: A Modeling Approach to Coll…
Algebra
ISBN:
9781337111348
Author:
Bruce Crauder, Benny Evans, Alan Noell
Publisher:
Cengage Learning
Algebra & Trigonometry with Analytic Geometry
Algebra
ISBN:
9781133382119
Author:
Swokowski
Publisher:
Cengage