Repeat the Procedure for n = 5 For the sample of n = 5 days averaged together, construct a histogram of the averages (your means together with the means of the other groups). Make intervals with bar widths of 1/2 a day. Sketch the graph using a ruler and pencil. Scale the axes. Draw a smooth curve through the tops of the bars of the histogram. Use one to two complete sentences to describe the general shape of the curve.
Repeat the Procedure for n = 5 For the sample of n = 5 days averaged together, construct a histogram of the averages (your means together with the means of the other groups). Make intervals with bar widths of 1/2 a day. Sketch the graph using a ruler and pencil. Scale the axes. Draw a smooth curve through the tops of the bars of the histogram. Use one to two complete sentences to describe the general shape of the curve.

Functions and Change: A Modeling Approach to College Algebra (MindTap Course List)
6th Edition
ISBN:9781337111348
Author:Bruce Crauder, Benny Evans, Alan Noell
Publisher:Bruce Crauder, Benny Evans, Alan Noell
Chapter1: Functions
Section1.2: Functions Given By Tables
Problem 20SBE: For these exercises, round all estimates to one decimal place. A Tabulated Function The following...

Related questions
Question
Repeat the Procedure for n = 5
- For the sample of n = 5 days averaged together, construct a histogram of the averages (your means together with the means of the other groups). Make intervals with bar widths of 1/2 a day. Sketch the graph using a ruler and pencil. Scale the axes.
- Draw a smooth curve through the tops of the bars of the histogram. Use one to two complete sentences to describe the general shape of the curve.
Repeat the Procedure for n = 10
- For the sample of n = 10 days averaged together, construct a histogram of the averages (your means together with the means of the other groups). Make intervals with bar widths of 1/2 a day. Sketch the graph using a ruler and pencil. Scale the axes.
- Draw a smooth curve through the tops of the bars of the histogram. Use one to two complete sentences to describe the general shape of the curve.
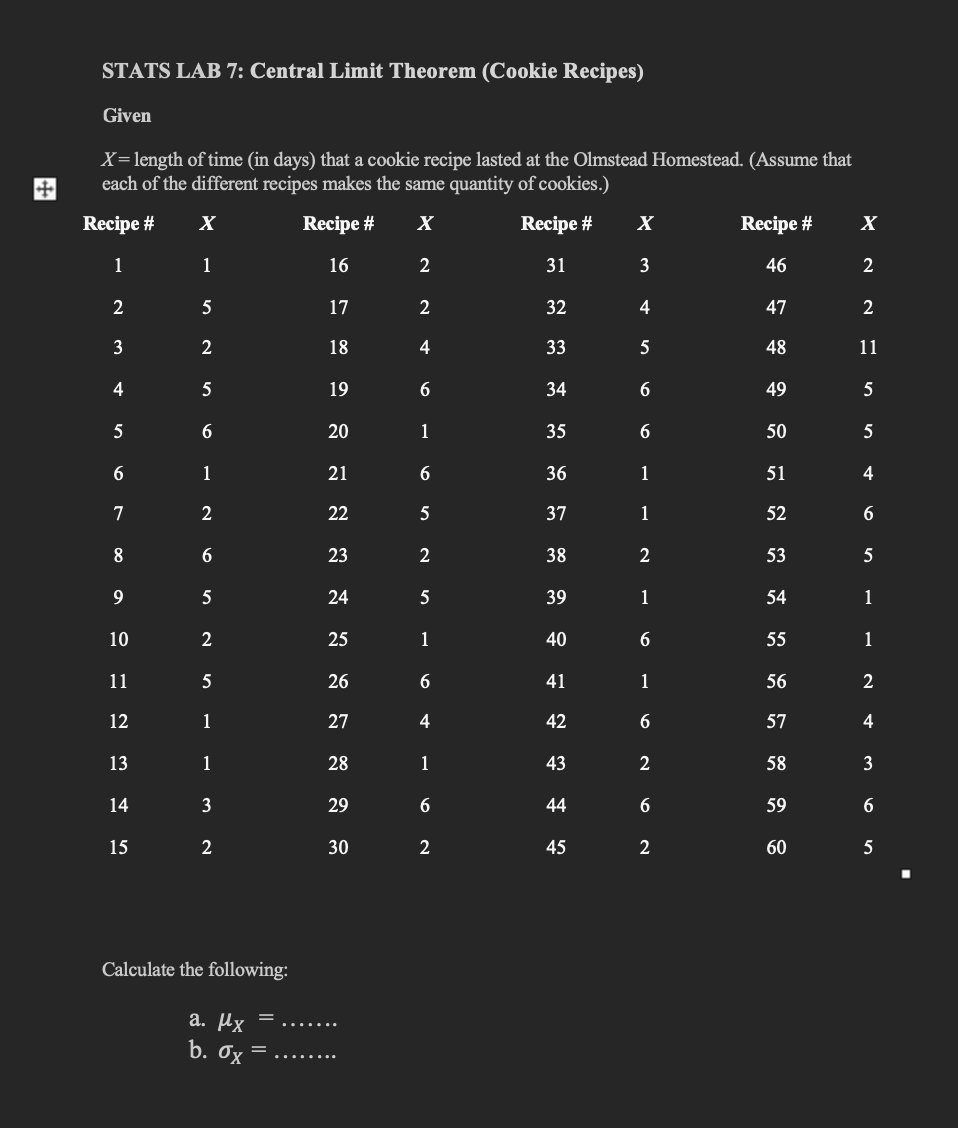
Transcribed Image Text:STATS LAB 7: Central Limit Theorem (Cookie Recipes)
Given
X = length of time (in days) that a cookie recipe lasted at the Olmstead Homestead. (Assume that
each of the different recipes makes the same quantity of cookies.)
Recipe #
X
Recipe #
X
Recipe #
1
1
16
2
31
5
17
32
2
18
33
19
34
20
35
21
36
22
37
38
39
2
3
4
5
6
7
8
9
10
11
12
13
14
15
5
6
1
2
6
5
2
5
1
1
3
2
Calculate the following:
a. Hy
b. ox
=
23
24
25
26
27
28
29
30
2
4
6
1
6
5
2
5
1
6
4
1
6
2
40 41 42 3 44 45
43
X
3
4
5
6
6
1
1
2
1
6
1
6
2
6
2
Recipe #
46
47
48
49
50
51
52
53
54
55
56
57
58
59
60
X
2
2
11
5
5
4
6
5
1
1
2
4
3
6
5
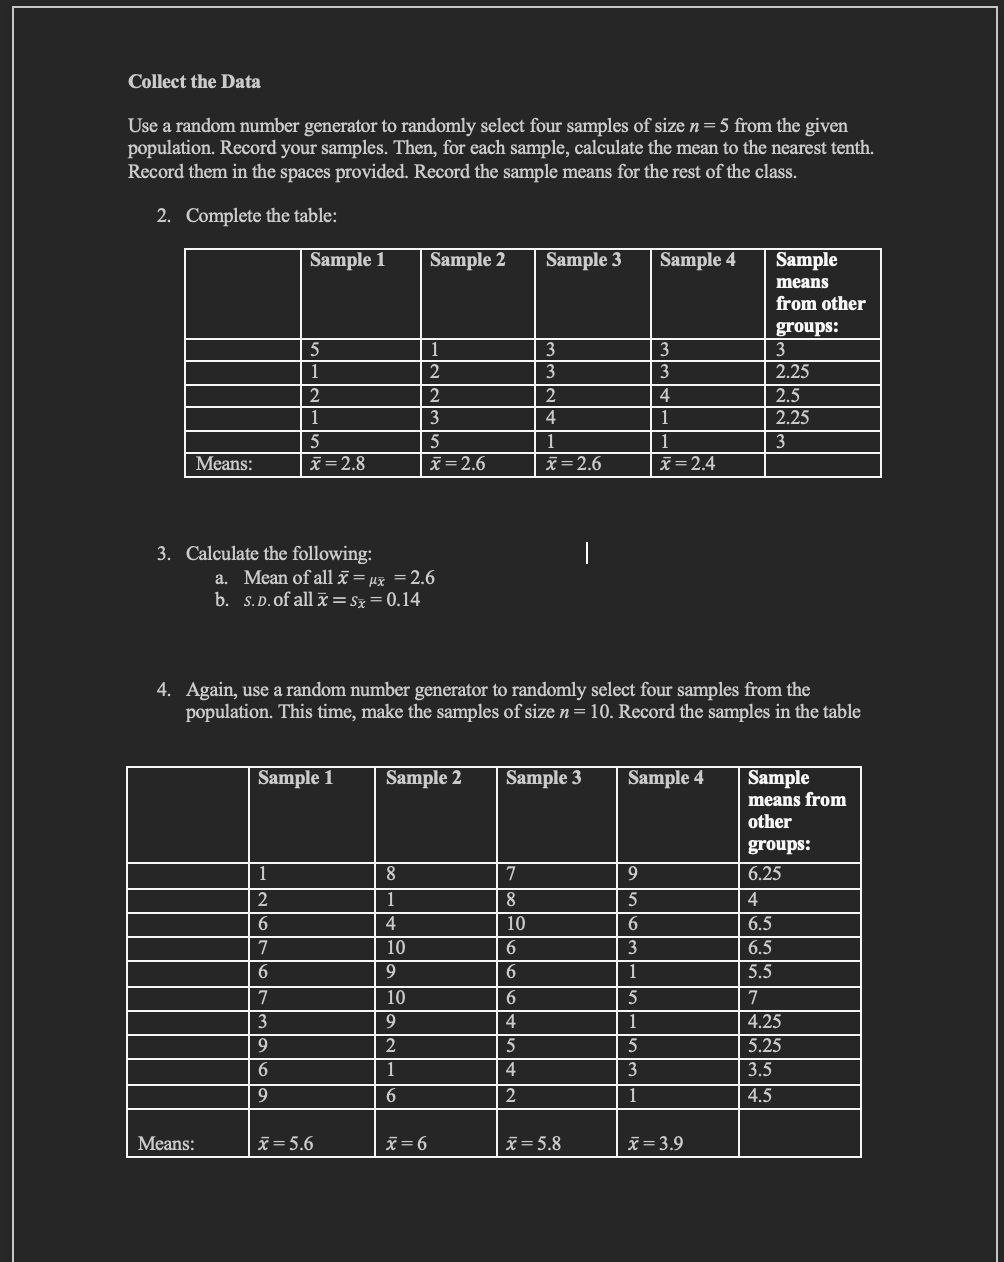
Transcribed Image Text:Collect the Data
Use a random number generator to randomly select four samples of size n = 5 from the given
population. Record your samples. Then, for each sample, calculate the mean to the nearest tenth.
Record them in the spaces provided. Record the sample means for the rest of the class.
2. Complete the table:
Means:
Means:
Sample 1
3. Calculate the following:
5
1
1
2
6
2
1
7
6
5
x = 2.8
7
3
9
6
9
Sample 1
a. Mean of all x = μx = 2.6
b. s. D. of all x = Sx = 0.14
x = 5.6
8
1
4
10
Sample 2
9
Sample 2
10
1
2
2
3
9
2
1
6
5
x = 2.6
4. Again, use a random number generator to randomly select four samples from the
population. This time, make the samples of size n = 10. Record the samples in the table
x = 6
Sample 3
7
8
10
6
6
3
3
6
4
5
4
2
2
4
1
x = 2.6
Sample 3
|
x = 5.8
Sample 4
9
5
6
3
1
3
3
5
1
5
3
1
4
1
1
x=2.4
Sample 4
Sample
means
from other
groups:
x = 3.9
3
2.25
2.5
2.25
3
Sample
means from
other
groups:
6.25
4
6.5
6.5
5.5
7
4.25
5.25
3.5
4.5
Expert Solution
This question has been solved!
Explore an expertly crafted, step-by-step solution for a thorough understanding of key concepts.

This is a popular solution!

Trending now
This is a popular solution!

Step by step
Solved in 4 steps with 4 images

Recommended textbooks for you
Functions and Change: A Modeling Approach to Coll…
Algebra
ISBN:
9781337111348
Author:
Bruce Crauder, Benny Evans, Alan Noell
Publisher:
Cengage Learning

Algebra & Trigonometry with Analytic Geometry
Algebra
ISBN:
9781133382119
Author:
Swokowski
Publisher:
Cengage
Functions and Change: A Modeling Approach to Coll…
Algebra
ISBN:
9781337111348
Author:
Bruce Crauder, Benny Evans, Alan Noell
Publisher:
Cengage Learning
Algebra & Trigonometry with Analytic Geometry
Algebra
ISBN:
9781133382119
Author:
Swokowski
Publisher:
Cengage