Required: Compute the following financial data for this year: 1. Accounts receivable turnover. (Assume that all sales are on account) (Round your answer to 2 decimal places.) 2. Average collection period. (Use 365 days in a year. Round your intermediate calculations and final answer to 2 decimal places.) 3. Inventory turnover. (Round your answer to 2 decimal places.) 4. Average sale period. (Use 365 days in a year. Round your Intermediate calculations and final answer to 2 decimal places.) 5. Operating cycle. (Round your intermediate calculations and final answer to 2 decimal places.) 6. Total asset turnover. (Round your answer to 2 decimal places.) 1. Accounts recelvable turnover 2. Average collection period 3. Inventory turnover days 4. Average sale period 5. Operating cycle 6. Total asset tumover days days
Required: Compute the following financial data for this year: 1. Accounts receivable turnover. (Assume that all sales are on account) (Round your answer to 2 decimal places.) 2. Average collection period. (Use 365 days in a year. Round your intermediate calculations and final answer to 2 decimal places.) 3. Inventory turnover. (Round your answer to 2 decimal places.) 4. Average sale period. (Use 365 days in a year. Round your Intermediate calculations and final answer to 2 decimal places.) 5. Operating cycle. (Round your intermediate calculations and final answer to 2 decimal places.) 6. Total asset turnover. (Round your answer to 2 decimal places.) 1. Accounts recelvable turnover 2. Average collection period 3. Inventory turnover days 4. Average sale period 5. Operating cycle 6. Total asset tumover days days

Chapter12: Capital Structure
Section: Chapter Questions
Problem 3PROB

Related questions

Concept explainers
Question
please answer within 30 minutes. its urgent.
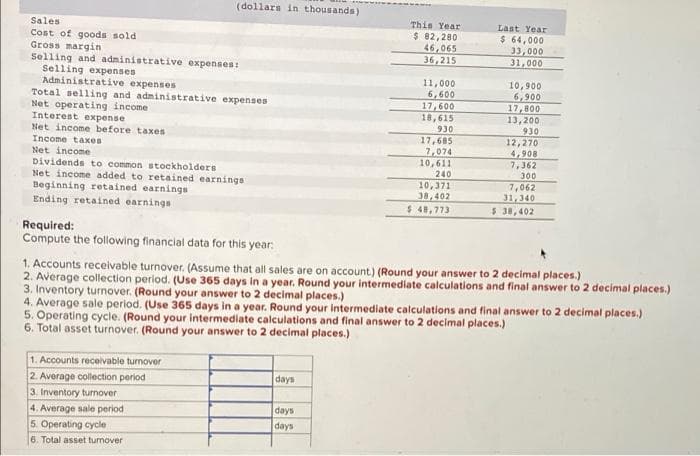
Transcribed Image Text:(dollars in thousands)
This Year
$ 82, 280
46,065
36,215
Sales
Last Year
$ 64,000
33,000
31,000
Cost of goods sold
Gross margin
Selling and administrative expenses:
Selling expenses
Administrative expenses
Total selling and administrative expenses
Net operating income
Interest expense
Net income before taxes
11,000
6,600
17,600
18,615
930
17,685
7,074
10,611
240
10,900
6,900
17,800
13,200
930
12,270
4,908
7,362
300
7,062
31,340
$ 38,402
Income taxes
Net income
Dividends to common stockholders
Net income added to retained earnings
Beginning retained earnings
Ending retained earnings
10,371
38,402
$ 48,773
Required:
Compute the following financial data for this year:
1. Accounts receivable turnover. (Assume that all sales are on account) (Round your answer to 2 decimal places.)
2. Average collection period. (Use 365 days in a year. Round your intermediate calculations and final answer to 2 decimal places.)
3. Inventory turnover. (Round your answer to 2 decimal places.)
4. Average sale period. (Use 365 days in a year. Round your Intermediate calculations and final answer to 2 decimal places.)
5. Operating cycle. (Round your intermediate calculations and final answer to 2 decimal places.)
6. Total asset turnover. (Round your answer to 2 decimal places.)
1. Accounts receivable turnover
2. Average collection period
3. Inventory turnover
4. Average sale period
5. Operating cycle
6. Total asset turnover
days
days
days
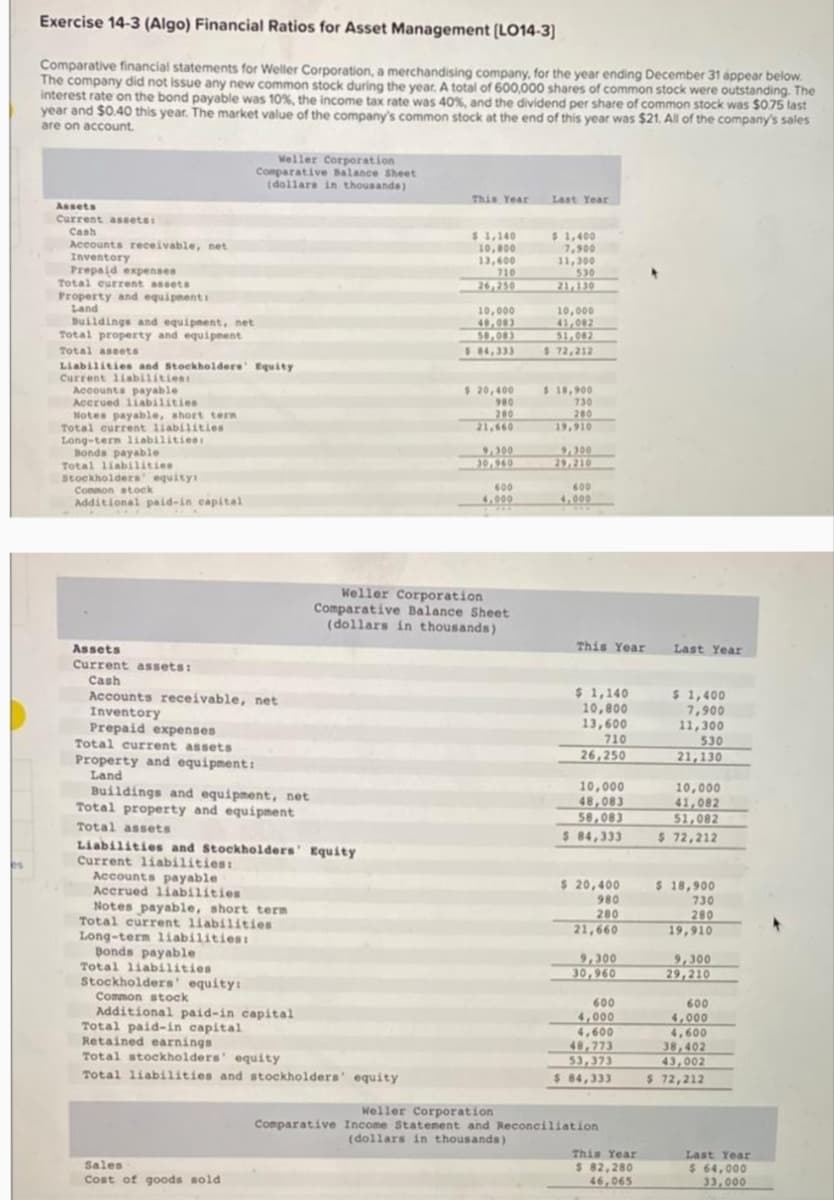
Transcribed Image Text:Exercise 14-3 (Algo) Financial Ratios for Asset Management (LO14-3)
Comparative financial statements for Weller Corporation, a merchandising company, for the year ending December 31 áppear below.
The company did not issue any new common stock during the year, A total of 600,000 shares of common stock were outstanding. The
interest rate on the bond payable was 10%, the income tax rate was 40% and the dividend per share of common stock was $0.75 last
year and $0.40 this year. The market value of the company's common stock at the end of this year was $21. All of the company's sales
are on account.
Weller Corporation
Comparative Balance Sheet
(dollars in thousande)
This Year
Last Year
Assets
Current assets:
Cash
Accounts receivable, net
Inventory
Prepaid expenses
Total eurrent assets
$1,140
10,800
13,600
710
26,250
$1,400
7,900
11,300
530
21,130
Property and equipnenti
Land
Buildings and equipnent, net
Total property and equipnent
10,000
40,083
50,083
10,000
41,002
51,082
$ 72,212
Total assets
$4,333
Liabilities and Stockhelders Equity
Current liabilities
Accounts payable
Accrued liabilities
Notes payable, short tern
Total current liabilities
Long-term liabilities1
Bonds payable
Total liabilities
stockholders' equity:
Conmon atoek
Additional paid-in capital
$20,400
980
$ 18,900
730
20
21,660
280
19,910
9,300
00,960
9,300
29,210
600
600
4,000
4,000
Weller Corporation
Comparative Balance Sheet
(dollars in thousands)
This Year
Assets
Current assets:
Last Year
Cash
Accounts receivable, net
Inventory
Prepaid expenses
Total current assets
$ 1,140
10,800
13,600
710
$ 1,400
7,900
11,300
530
21,130
26,250
Property and equipment:
Land
Buildings and equipment, net
Total property and equipment
10,000
48,083
58,083
$ 84,333
10,000
41,082
51,082
$ 72,212
Total assets
Liabilities and Stockholders' Equity
Current liabilities:
Accounts payable
Accrued liabilities
$ 20,400
$ 18,900
730
280
19,910
980
Notes payable, short tern
Total current liabilities
Long-term liabilities:
Bonds payable
Total liabilities
Stockholders' equity:
Common stock
Additional paid-in capital
Total paid-in capital
Retained earnings
Total stockholders' equity
280
21,660
9,300
30,960
9,300
29,210
600
4,000
4,600
48,773
53,373
$ 84,333
600
4,000
4,600
38,402
43,002
$ 72,212
Total liabilities and stockholders' equity
Weller Corporation
Comparative Income Statement and Reconciliation
(dollars in thousands)
This Year
$ 82,280
Last Year
Sales
$ 64,000
33,000
Cost of goods sold
46,065
Expert Solution
This question has been solved!
Explore an expertly crafted, step-by-step solution for a thorough understanding of key concepts.

This is a popular solution!

Trending now
This is a popular solution!

Step by step
Solved in 2 steps

Knowledge Booster


Learn more about
Need a deep-dive on the concept behind this application? Look no further. Learn more about this topic, accounting and related others by exploring similar questions and additional content below.Recommended textbooks for you

Fundamentals of Financial Management, Concise Edi…
Finance
ISBN:
9781305635937
Author:
Eugene F. Brigham, Joel F. Houston
Publisher:
Cengage Learning

Survey of Accounting (Accounting I)
Accounting
ISBN:
9781305961883
Author:
Carl Warren
Publisher:
Cengage Learning
Fundamentals of Financial Management, Concise Edi…
Finance
ISBN:
9781305635937
Author:
Eugene F. Brigham, Joel F. Houston
Publisher:
Cengage Learning
Survey of Accounting (Accounting I)
Accounting
ISBN:
9781305961883
Author:
Carl Warren
Publisher:
Cengage Learning

Intermediate Accounting: Reporting And Analysis
Accounting
ISBN:
9781337788281
Author:
James M. Wahlen, Jefferson P. Jones, Donald Pagach
Publisher:
Cengage Learning