Required information AD Real Domestic Product, GDP er to the above graph. Which of the following factors explains a movement along the AD curve? Multiple Choice Multiple Choice O Changes in the ability of household to borrow funds The degree of excess capacity in the economy Real interest-rote changes implemented by the government Price Level
Required information AD Real Domestic Product, GDP er to the above graph. Which of the following factors explains a movement along the AD curve? Multiple Choice Multiple Choice O Changes in the ability of household to borrow funds The degree of excess capacity in the economy Real interest-rote changes implemented by the government Price Level

Chapter8: Aggregate Demand And Aggregate Supply
Section: Chapter Questions
Problem 3WNG

Related questions
Question
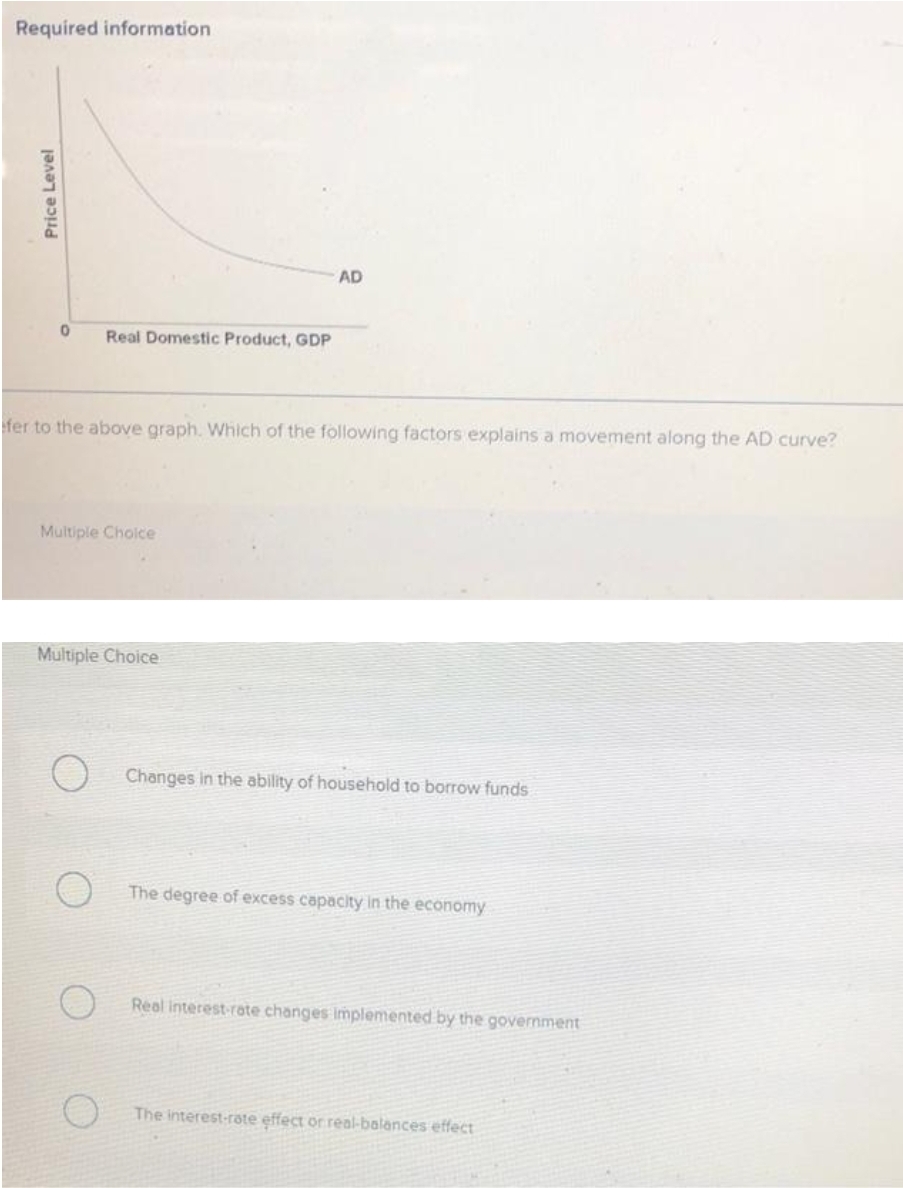
Transcribed Image Text:Required information
AD
Real Domestic Product, GDP
fer to the above graph. Which of the following factors explains a movement along the AD curve?
Multiple Choice
Multiple Choice
Changes in the ability of household to borrow funds
The degree of excess capacity in the economy
Real interest-rate changes implemented by the government
The interest-rate effect or real-balances effect
Price Level
Expert Solution
This question has been solved!
Explore an expertly crafted, step-by-step solution for a thorough understanding of key concepts.

Step by step
Solved in 2 steps

Recommended textbooks for you

Economics (MindTap Course List)
Economics
ISBN:
9781337617383
Author:
Roger A. Arnold
Publisher:
Cengage Learning

Economics (MindTap Course List)
Economics
ISBN:
9781337617383
Author:
Roger A. Arnold
Publisher:
Cengage Learning

Macroeconomics: Principles and Policy (MindTap Co…
Economics
ISBN:
9781305280601
Author:
William J. Baumol, Alan S. Blinder
Publisher:
Cengage Learning

Exploring Economics
Economics
ISBN:
9781544336329
Author:
Robert L. Sexton
Publisher:
SAGE Publications, Inc

Principles of Economics 2e
Economics
ISBN:
9781947172364
Author:
Steven A. Greenlaw; David Shapiro
Publisher:
OpenStax