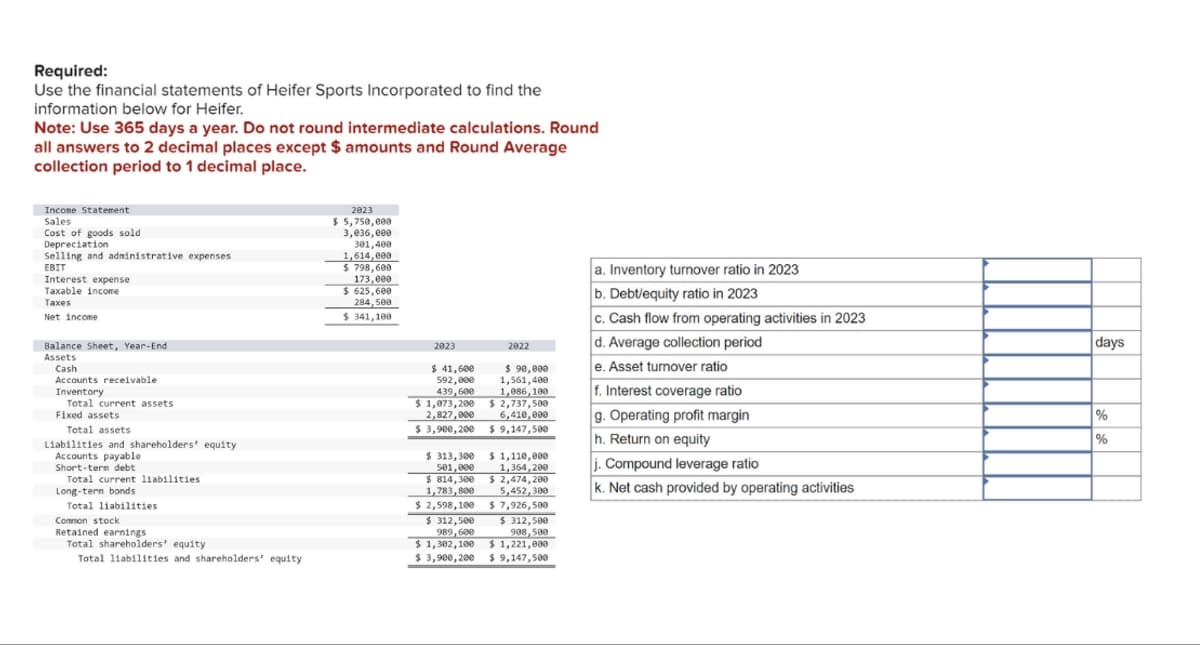
Required: Use the financial statements of Heifer Sports Incorporated to find the information below for Heifer. Note: Use 365 days a year. Do not round intermediate calculations. Round all answers to 2 decimal places except $ amounts and Round Average collection period to 1 decimal place. Income Statement Sales Cost of goods sold Depreciation Selling and administrative expenses EBIT Interest expense Taxable income Taxes Net income 2023 $5,750,000 3,036,000 301,400 1,614,000 $ 798,600 173,000 $ 625,600 284,500 $ 341,100 Balance Sheet, Year-End Assets Cash Accounts receivable Inventory Total current assets Fixed assets Total assets Liabilities and shareholders' equity Accounts payable Short-term debt Total current liabilities Long-term bonds Total liabilities Common stock Retained earnings Total shareholders' equity Total liabilities and shareholders' equity 2023 $ 41,600 592,000 439,600 $ 1,073,200 2,827,000 $ 3,900,200 $ 313,300 501,000 $ 814,300 1,783,800 $2,598,100 $ 312,500 989,600 $ 1,302,100 2022 $ 90,000 1,561,400 1,086,100 $2,737,500 6,410,000 $ 9,147,500 $ 1,110,000 1,364,200 $ 2,474,200 5,452,300 $ 7,926,500 $ 312,500 908,500 $ 1,221,000 $ 3,900,200 $ 9,147,500 a. Inventory turnover ratio in 2023 b. Debt/equity ratio in 2023 c. Cash flow from operating activities in 2023 d. Average collection period e. Asset turnover ratio f. Interest coverage ratio g. Operating profit margin h. Return on equity j. Compound leverage ratio k. Net cash provided by operating activities days % %
Required: Use the financial statements of Heifer Sports Incorporated to find the information below for Heifer. Note: Use 365 days a year. Do not round intermediate calculations. Round all answers to 2 decimal places except $ amounts and Round Average collection period to 1 decimal place. Income Statement Sales Cost of goods sold Depreciation Selling and administrative expenses EBIT Interest expense Taxable income Taxes Net income 2023 $5,750,000 3,036,000 301,400 1,614,000 $ 798,600 173,000 $ 625,600 284,500 $ 341,100 Balance Sheet, Year-End Assets Cash Accounts receivable Inventory Total current assets Fixed assets Total assets Liabilities and shareholders' equity Accounts payable Short-term debt Total current liabilities Long-term bonds Total liabilities Common stock Retained earnings Total shareholders' equity Total liabilities and shareholders' equity 2023 $ 41,600 592,000 439,600 $ 1,073,200 2,827,000 $ 3,900,200 $ 313,300 501,000 $ 814,300 1,783,800 $2,598,100 $ 312,500 989,600 $ 1,302,100 2022 $ 90,000 1,561,400 1,086,100 $2,737,500 6,410,000 $ 9,147,500 $ 1,110,000 1,364,200 $ 2,474,200 5,452,300 $ 7,926,500 $ 312,500 908,500 $ 1,221,000 $ 3,900,200 $ 9,147,500 a. Inventory turnover ratio in 2023 b. Debt/equity ratio in 2023 c. Cash flow from operating activities in 2023 d. Average collection period e. Asset turnover ratio f. Interest coverage ratio g. Operating profit margin h. Return on equity j. Compound leverage ratio k. Net cash provided by operating activities days % %

Financial Accounting: The Impact on Decision Makers
10th Edition
ISBN:9781305654174
Author:Gary A. Porter, Curtis L. Norton
Publisher:Gary A. Porter, Curtis L. Norton
Chapter4: Income Measurement And Accrual Accounting
Section: Chapter Questions
Problem 4.33E

Related questions
Question
Transcribed Image Text:Required:
Use the financial statements of Heifer Sports Incorporated to find the
information below for Heifer.
Note: Use 365 days a year. Do not round intermediate calculations. Round
all answers to 2 decimal places except $ amounts and Round Average
collection period to 1 decimal place.
Income Statement
Sales
Cost of goods sold
Depreciation
Selling and administrative expenses
EBIT
Interest expense
Taxable income
Taxes
Net income
2023
$5,750,000
3,036,000
301,400
1,614,000
$ 798,600
173,000
$ 625,600
284,500
$ 341,100
Balance Sheet, Year-End
Assets
Cash
Accounts receivable
Inventory
Total current assets
Fixed assets
Total assets
Liabilities and shareholders' equity
Accounts payable
Short-term debt
Total current liabilities
Long-term bonds
Total liabilities
Common stock
Retained earnings
Total shareholders' equity
Total liabilities and shareholders' equity
2023
$ 41,600
592,000
439,600
$ 1,073,200
2,827,000
$ 3,900,200
$ 313,300
501,000
$ 814,300
1,783,800
$2,598,100
$ 312,500
989,600
$ 1,302,100
2022
$ 90,000
1,561,400
1,086,100
$2,737,500
6,410,000
$ 9,147,500
$ 1,110,000
1,364,200
$ 2,474,200
5,452,300
$ 7,926,500
$ 312,500
908,500
$ 1,221,000
$ 3,900,200 $ 9,147,500
a. Inventory turnover ratio in 2023
b. Debt/equity ratio in 2023
c. Cash flow from operating activities in 2023
d. Average collection period
e. Asset turnover ratio
f. Interest coverage ratio
g. Operating profit margin
h. Return on equity
j. Compound leverage ratio
k. Net cash provided by operating activities
days
%
%
Expert Solution
This question has been solved!
Explore an expertly crafted, step-by-step solution for a thorough understanding of key concepts.

This is a popular solution!

Trending now
This is a popular solution!

Step by step
Solved in 2 steps

Recommended textbooks for you
Financial Accounting: The Impact on Decision Make…
Accounting
ISBN:
9781305654174
Author:
Gary A. Porter, Curtis L. Norton
Publisher:
Cengage Learning

Intermediate Accounting: Reporting And Analysis
Accounting
ISBN:
9781337788281
Author:
James M. Wahlen, Jefferson P. Jones, Donald Pagach
Publisher:
Cengage Learning

Financial Accounting
Accounting
ISBN:
9781305088436
Author:
Carl Warren, Jim Reeve, Jonathan Duchac
Publisher:
Cengage Learning
Financial Accounting: The Impact on Decision Make…
Accounting
ISBN:
9781305654174
Author:
Gary A. Porter, Curtis L. Norton
Publisher:
Cengage Learning
Intermediate Accounting: Reporting And Analysis
Accounting
ISBN:
9781337788281
Author:
James M. Wahlen, Jefferson P. Jones, Donald Pagach
Publisher:
Cengage Learning
Financial Accounting
Accounting
ISBN:
9781305088436
Author:
Carl Warren, Jim Reeve, Jonathan Duchac
Publisher:
Cengage Learning

Managerial Accounting: The Cornerstone of Busines…
Accounting
ISBN:
9781337115773
Author:
Maryanne M. Mowen, Don R. Hansen, Dan L. Heitger
Publisher:
Cengage Learning

Financial Accounting
Accounting
ISBN:
9781337272124
Author:
Carl Warren, James M. Reeve, Jonathan Duchac
Publisher:
Cengage Learning

Cornerstones of Financial Accounting
Accounting
ISBN:
9781337690881
Author:
Jay Rich, Jeff Jones
Publisher:
Cengage Learning