Requlred: 1. Using the least-squares regression method, estimate the variable utilities cost per ton mined and the total fixed utilities cost per quarter. Express these estimates in the form Y = a + bX. (Round the Varlable cost per unlt to 2 decimal places and Flxed Cost to the nearest whole dollar amount.)
Requlred: 1. Using the least-squares regression method, estimate the variable utilities cost per ton mined and the total fixed utilities cost per quarter. Express these estimates in the form Y = a + bX. (Round the Varlable cost per unlt to 2 decimal places and Flxed Cost to the nearest whole dollar amount.)

Chapter6: Systems Of Equations And Inequalities
Section: Chapter Questions
Problem 17PS: Cholesterol Cholesterol in human blood is necessary, but too much can lead to health problems. There...

Related questions

Question
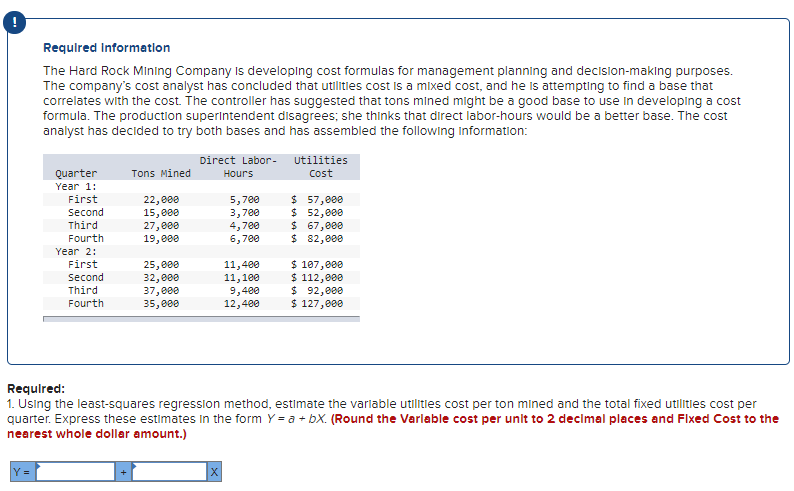
Transcribed Image Text:Requlred Informatlon
The Hard Rock MIining Company Is developing cost formulas for management planning and decision-makıng purposes.
The company's cost analyst has concluded that utilitles cost Is a mixed cost, and he Is attempting to find a base that
correlates with the cost. The controller has suggested that tons mined might be a good base to use in developing a cost
formula. The production superintendent disagrees; she thinks that direct labor-hours would be a better base. The cost
analyst has decided to try both bases and has assembled the following information:
Direct Labor-
utilities
Quarter
Tons Mined
Hours
Cost
Year 1:
5,700
3,700
4,700
6,700
$ 57,000
$ 52,000
$ 67,000
$ 82,000
First
Second
Third
Fourth
22, 000
15,000
27,000
19,000
Year 2:
First
25,000
32,e00
37,000
35,000
11,400
11,100
9,400
12,400
$ 107,000
$ 112,000
$ 92,000
$ 127,000
Second
Third
Fourth
Requlred:
1. Using the least-squares regression method, estimate the varlable utilities cost per ton mined and the total fixed utilitlies cost per
quarter. Express these estimates in the form Y = a + bX. (Round the Varlable cost per unit to 2 decimal places and Flxed Cost to the
nearest whole dollar amount.)
Y =
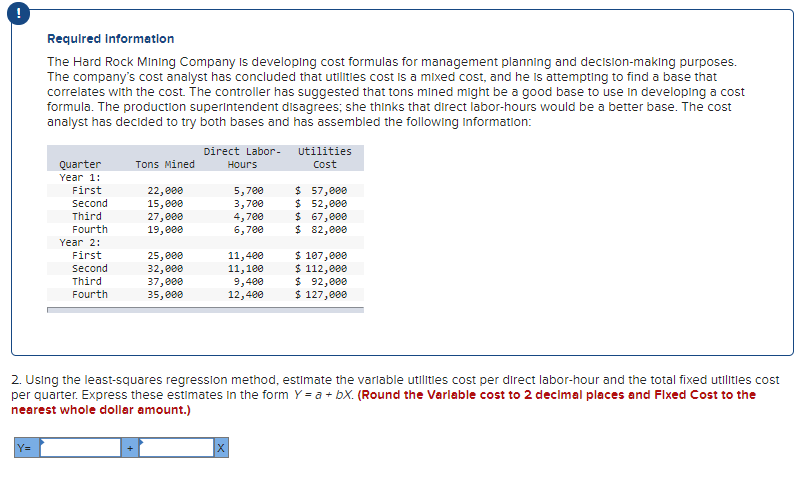
Transcribed Image Text:Requlred Informatlon
The Hard Rock MIining Company Is developing cost formulas for management planning and decision-making purposes.
The company's cost analyst has concluded that utilities cost is a mixed cost, and he is attempting to find a base that
correlates with the cost. The controller has suggested that tons mined might be a good base to use in developing a cost
formula. The production superintendent disagrees; she thinks that direct labor-hours would be a better base. The cost
analyst has decided to try both bases and has assembled the following information:
Direct Labor- utilities
Quarter
Tons Mined
Hours
Cost
Year 1:
$ 57,000
$ 52,000
$ 67,000
$ 82,000
First
22,000
15,000
27,000
19,000
5,700
3,700
4,700
6,700
Second
Third
Fourth
Year 2:
First
25,000
32, eee
37,000
35,000
11,400
11,100
9,400
12,400
$ 107,000
$ 112,000
$ 92,000
$ 127,000
Second
Third
Fourth
2. Using the least-squares regresslon method, estimate the varlable utlitles cost per direct labor-hour and the total fixed utilities cost
per quarter. Express these estimates In the form Y = a + bx. (Round the Varlable cost to 2 decimal places and Flxed Cost to the
nearest whole dollar amount.)
Y%D
Expert Solution
This question has been solved!
Explore an expertly crafted, step-by-step solution for a thorough understanding of key concepts.

This is a popular solution!

Trending now
This is a popular solution!

Step by step
Solved in 2 steps with 2 images

Knowledge Booster


Learn more about
Need a deep-dive on the concept behind this application? Look no further. Learn more about this topic, statistics and related others by exploring similar questions and additional content below.Recommended textbooks for you