The following experimental data points are to be fitted to this 3-model parameter equation: In(y) = a- b(x +c)-1 -16 -6 11 34 65 y 10 20 60 200 760 Using least square regression find the values of a, b, and c. Also find the value of coefficio of determination r.
The following experimental data points are to be fitted to this 3-model parameter equation: In(y) = a- b(x +c)-1 -16 -6 11 34 65 y 10 20 60 200 760 Using least square regression find the values of a, b, and c. Also find the value of coefficio of determination r.

Advanced Engineering Mathematics
10th Edition
ISBN:9780470458365
Author:Erwin Kreyszig
Publisher:Erwin Kreyszig
Chapter2: Second-order Linear Odes
Section: Chapter Questions
Problem 1RQ

Related questions
Topic Video
Question
Plzzz explain.
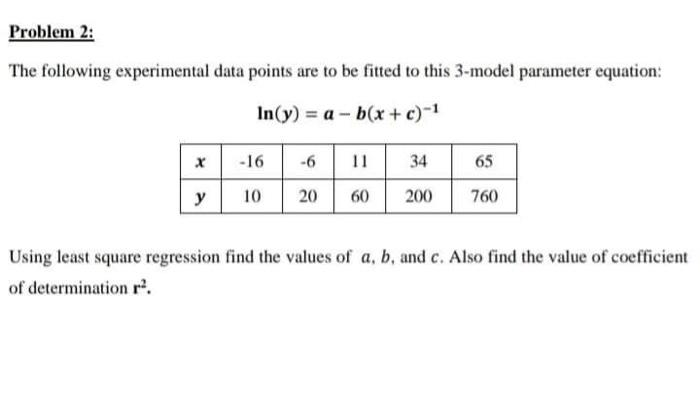
Transcribed Image Text:Problem 2:
The following experimental data points are to be fitted to this 3-model parameter equation:
In(y) = a- b(x+c)-1
-16
-6
11
34
65
y
10
20
60
200
760
Using least square regression find the values of a, b, and c. Also find the value of coefficient
of determination r.
Expert Solution
This question has been solved!
Explore an expertly crafted, step-by-step solution for a thorough understanding of key concepts.

This is a popular solution!

Trending now
This is a popular solution!

Step by step
Solved in 6 steps

Knowledge Booster


Learn more about
Need a deep-dive on the concept behind this application? Look no further. Learn more about this topic, advanced-math and related others by exploring similar questions and additional content below.Recommended textbooks for you
Advanced Engineering Mathematics
Advanced Math
ISBN:
9780470458365
Author:
Erwin Kreyszig
Publisher:
Wiley, John & Sons, Incorporated

Numerical Methods for Engineers
Advanced Math
ISBN:
9780073397924
Author:
Steven C. Chapra Dr., Raymond P. Canale
Publisher:
McGraw-Hill Education

Introductory Mathematics for Engineering Applicat…
Advanced Math
ISBN:
9781118141809
Author:
Nathan Klingbeil
Publisher:
WILEY
Advanced Engineering Mathematics
Advanced Math
ISBN:
9780470458365
Author:
Erwin Kreyszig
Publisher:
Wiley, John & Sons, Incorporated
Numerical Methods for Engineers
Advanced Math
ISBN:
9780073397924
Author:
Steven C. Chapra Dr., Raymond P. Canale
Publisher:
McGraw-Hill Education
Introductory Mathematics for Engineering Applicat…
Advanced Math
ISBN:
9781118141809
Author:
Nathan Klingbeil
Publisher:
WILEY

Mathematics For Machine Technology
Advanced Math
ISBN:
9781337798310
Author:
Peterson, John.
Publisher:
Cengage Learning,

