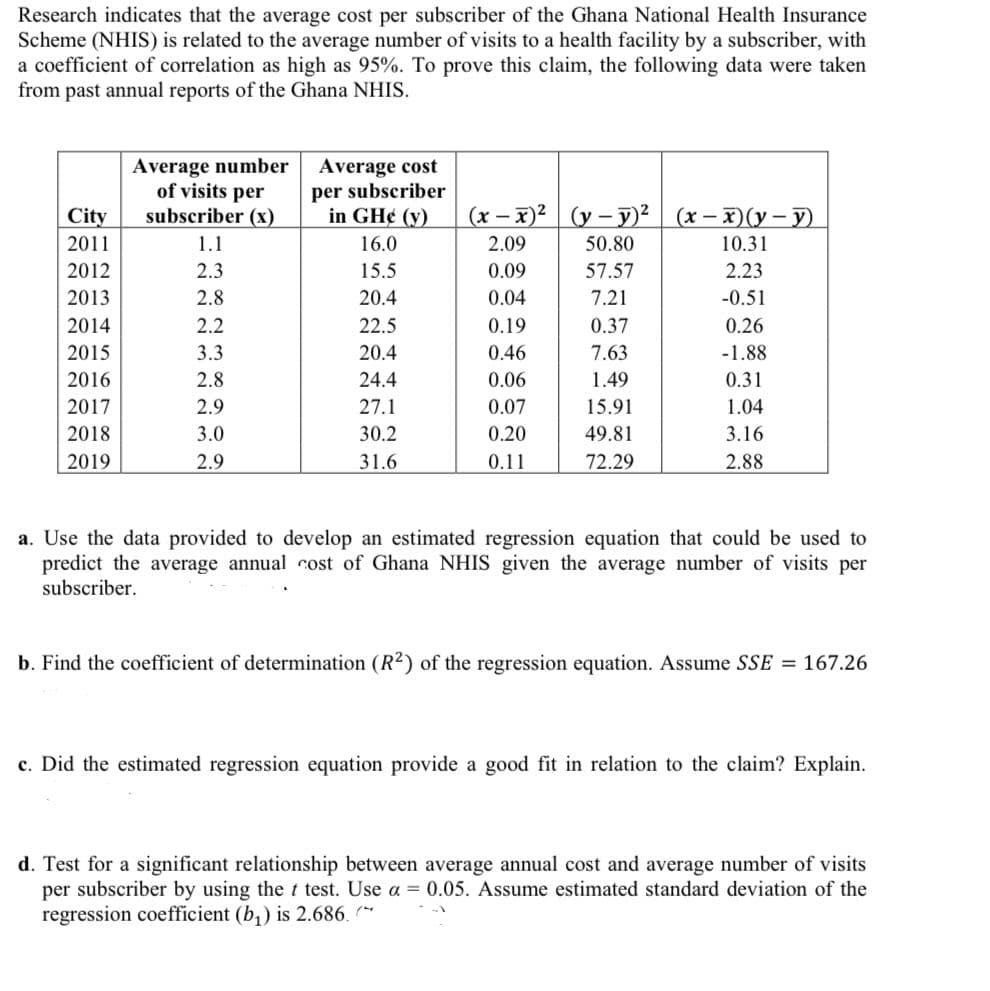
Research indicates that the average cost per subscriber of the Ghana National Health Insurance Scheme (NHIS) is related to the average number of visits to a health facility by a subscriber, with a coefficient of correlation as high as 95%. To prove this claim, the following data were taken from past annual reports of the Ghana NHIS. Average number of visits per subscriber (x) Average cost per subscriber in GH¢ (y) City (х — х)2 | (у — у)? | (х — X)(у —У) 2011 1.1 16.0 2.09 50.80 10.31 2012 2.3 15.5 0.09 57.57 2.23 2013 2.8 20.4 0.04 7.21 -0.51 2014 2.2 22.5 0.19 0.37 0.26 2015 3.3 20.4 0.46 7.63 -1.88 2016 2.8 24.4 0.06 1.49 0.31 2017 2.9 27.1 0.07 15.91 1.04 2018 3.0 30.2 0.20 49.81 3.16 2019 2.9 31.6 0.11 72.29 2.88 a. Use the data provided to develop an estimated regression equation that could be used to predict the average annual cost of Ghana NHIS given the average number of visits per subscriber. b. Find the coefficient of determination (R2) of the regression equation. Assume SSE = 167.26 %3D c. Did the estimated regression equation provide a good fit in relation to the claim? Explain. d. Test for a significant relationship between average annual cost and average number of visits per subscriber by using the t test. Use a = 0.05. Assume estimated standard deviation of the regression coefficient (b,) is 2.686. *
Research indicates that the average cost per subscriber of the Ghana National Health Insurance Scheme (NHIS) is related to the average number of visits to a health facility by a subscriber, with a coefficient of correlation as high as 95%. To prove this claim, the following data were taken from past annual reports of the Ghana NHIS. Average number of visits per subscriber (x) Average cost per subscriber in GH¢ (y) City (х — х)2 | (у — у)? | (х — X)(у —У) 2011 1.1 16.0 2.09 50.80 10.31 2012 2.3 15.5 0.09 57.57 2.23 2013 2.8 20.4 0.04 7.21 -0.51 2014 2.2 22.5 0.19 0.37 0.26 2015 3.3 20.4 0.46 7.63 -1.88 2016 2.8 24.4 0.06 1.49 0.31 2017 2.9 27.1 0.07 15.91 1.04 2018 3.0 30.2 0.20 49.81 3.16 2019 2.9 31.6 0.11 72.29 2.88 a. Use the data provided to develop an estimated regression equation that could be used to predict the average annual cost of Ghana NHIS given the average number of visits per subscriber. b. Find the coefficient of determination (R2) of the regression equation. Assume SSE = 167.26 %3D c. Did the estimated regression equation provide a good fit in relation to the claim? Explain. d. Test for a significant relationship between average annual cost and average number of visits per subscriber by using the t test. Use a = 0.05. Assume estimated standard deviation of the regression coefficient (b,) is 2.686. *

Glencoe Algebra 1, Student Edition, 9780079039897, 0079039898, 2018
18th Edition
ISBN:9780079039897
Author:Carter
Publisher:Carter
Chapter4: Equations Of Linear Functions
Section4.5: Correlation And Causation
Problem 2CYU

Related questions
Question
Transcribed Image Text:Research indicates that the average cost per subscriber of the Ghana National Health Insurance
Scheme (NHIS) is related to the average number of visits to a health facility by a subscriber, with
a coefficient of correlation as high as 95%. To prove this claim, the following data were taken
from past annual reports of the Ghana NHIS.
Average number
of visits per
subscriber (x)
Average cost
per subscriber
in GH¢ (y)
City
(x – x)² (y – y)²
(x-x)(y-y)
2011
1.1
16.0
2.09
50.80
10.31
2012
2.3
15.5
0.09
57.57
2.23
2013
2.8
20.4
0.04
7.21
-0.51
2014
2.2
22.5
0.19
0.37
0.26
2015
3.3
20.4
0.46
7.63
-1.88
2016
2.8
24.4
0.06
1.49
0.31
2017
2.9
27.1
0.07
15.91
1.04
2018
3.0
30.2
0.20
49.81
3.16
2019
2.9
31.6
0.11
72.29
2.88
a. Use the data provided to develop an estimated regression equation that could be used to
predict the average annual cost of Ghana NHIS given the average number of visits per
subscriber.
b. Find the coefficient of determination (R2) of the regression equation. Assume SSE = 167.26
c. Did the estimated regression equation provide a good fit in relation to the claim? Explain.
d. Test for a significant relationship between average annual cost and average number of visits
per subscriber by using the t test. Use a = 0.05. Assume estimated standard deviation of the
regression coefficient (b,) is 2.686. **
m 00 N M
Expert Solution
This question has been solved!
Explore an expertly crafted, step-by-step solution for a thorough understanding of key concepts.

Step by step
Solved in 4 steps

Recommended textbooks for you
Glencoe Algebra 1, Student Edition, 9780079039897…
Algebra
ISBN:
9780079039897
Author:
Carter
Publisher:
McGraw Hill

Big Ideas Math A Bridge To Success Algebra 1: Stu…
Algebra
ISBN:
9781680331141
Author:
HOUGHTON MIFFLIN HARCOURT
Publisher:
Houghton Mifflin Harcourt
Glencoe Algebra 1, Student Edition, 9780079039897…
Algebra
ISBN:
9780079039897
Author:
Carter
Publisher:
McGraw Hill
Big Ideas Math A Bridge To Success Algebra 1: Stu…
Algebra
ISBN:
9781680331141
Author:
HOUGHTON MIFFLIN HARCOURT
Publisher:
Houghton Mifflin Harcourt