Researchers at a car resale company are trying to build a model to predict a car’s 4- year resale value (in thousands of dollars) from several predictor variables. The variables they selected follow. a) What is the equation of the least-squares regression line? A particular car (not a truck) cost $40,000 and has an engine of 3.8 liters. What do you predict the 4-year resale value of this car will be? b) Use α = 0.05 to test the significance of β1. Should x1 be dropped from the model? c) Test if there exists any linear relationship between the dependent variable and any of the independent variables, i.e., test H0 : B1=B2=B3= 0 at 5% significance level.
Researchers at a car resale company are trying to build a model to predict a car’s 4- year resale value (in thousands of dollars) from several predictor variables. The variables they selected follow. a) What is the equation of the least-squares regression line? A particular car (not a truck) cost $40,000 and has an engine of 3.8 liters. What do you predict the 4-year resale value of this car will be? b) Use α = 0.05 to test the significance of β1. Should x1 be dropped from the model? c) Test if there exists any linear relationship between the dependent variable and any of the independent variables, i.e., test H0 : B1=B2=B3= 0 at 5% significance level.

Linear Algebra: A Modern Introduction
4th Edition
ISBN:9781285463247
Author:David Poole
Publisher:David Poole
Chapter7: Distance And Approximation
Section7.3: Least Squares Approximation
Problem 31EQ

Related questions
Question
Researchers at a car resale company are trying to build a model to predict a car’s 4-
year resale value (in thousands of dollars) from several predictor variables. The variables they
selected follow.
a) What is the equation of the least-squares regression line? A particular car (not a
truck) cost $40,000 and has an engine of 3.8 liters. What do you predict the 4-year resale
value of this car will be?
b) Use α = 0.05 to test the significance of β1. Should x1 be dropped from the model?
c) Test if there exists any linear relationship between the dependent variable and any
of the independent variables, i.e., test H0 : B1=B2=B3= 0 at 5% significance level.
Transcribed Image Text:Model
1
Engine
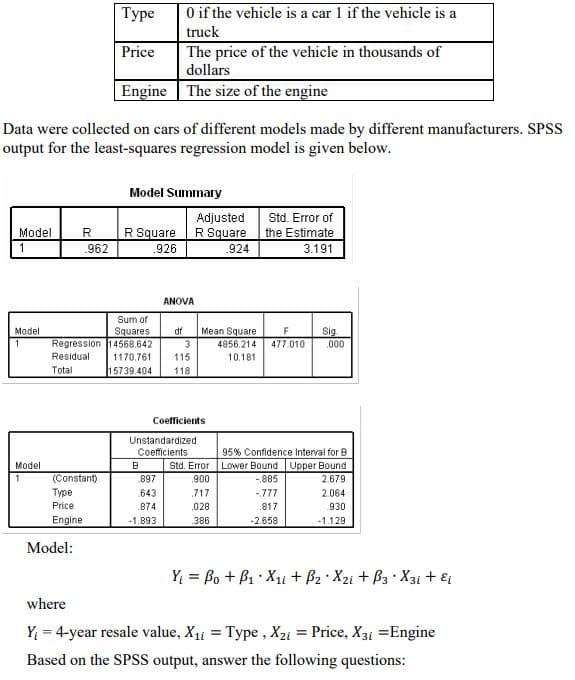
Data were collected on cars of different models made by different manufacturers. SPSS
output for the least-squares regression model is given below.
Model
1
Model
1
R
.962
Regression
Residual
Total
(Constant)
Type
Price
Engine
Model:
Type
Price
Model Summary
R Square
.926
0 if the vehicle is a car 1 if the vehicle is a
truck
The price of the vehicle in thousands of
dollars
The size of the engine
Sum of
Squares df
14568.642
3
1170.761 115
15739.404 118
B
ANOVA
897
643
.874
-1.893
Adjusted
R Square
.924
Unstandardized
Coefficients
Coefficients
Mean Square
Std. Error
,900
717
.028
.386
Std. Error of
the Estimate
3.191
F
Sig
4856.214 477.010 .000
10.181
95% Confidence Interval for B
Lower Bound Upper Bound
-.885
2.679
2.064
930
-1.129
-.777
.817
-2.658
Y₁ = Bo + B₁ X₁1 + B₂ X2i + B3 X31 + Ei
where
Y₁ = 4-year resale value, X₁1 = Type, X₂i = Price, X31 = Engine
Based on the SPSS output, answer the following questions:
Expert Solution
This question has been solved!
Explore an expertly crafted, step-by-step solution for a thorough understanding of key concepts.

This is a popular solution!

Trending now
This is a popular solution!

Step by step
Solved in 2 steps

Recommended textbooks for you
Linear Algebra: A Modern Introduction
Algebra
ISBN:
9781285463247
Author:
David Poole
Publisher:
Cengage Learning

Elementary Linear Algebra (MindTap Course List)
Algebra
ISBN:
9781305658004
Author:
Ron Larson
Publisher:
Cengage Learning
Linear Algebra: A Modern Introduction
Algebra
ISBN:
9781285463247
Author:
David Poole
Publisher:
Cengage Learning
Elementary Linear Algebra (MindTap Course List)
Algebra
ISBN:
9781305658004
Author:
Ron Larson
Publisher:
Cengage Learning