a) Calculate the sample mean and sample standard deviation for both the "Unemployment Rate" and "Crime Rate per Thousand Population" variables.
a) Calculate the sample mean and sample standard deviation for both the "Unemployment Rate" and "Crime Rate per Thousand Population" variables.

MATLAB: An Introduction with Applications
6th Edition
ISBN:9781119256830
Author:Amos Gilat
Publisher:Amos Gilat
Chapter1: Starting With Matlab
Section: Chapter Questions
Problem 1P

Related questions
Question
How can I work out question 3 (b)?
Transcribed Image Text:←
17:43
3 of 3
Question 3
Region
North
FIN303 Class Test Revision(1).pdf
Page 2 of 6
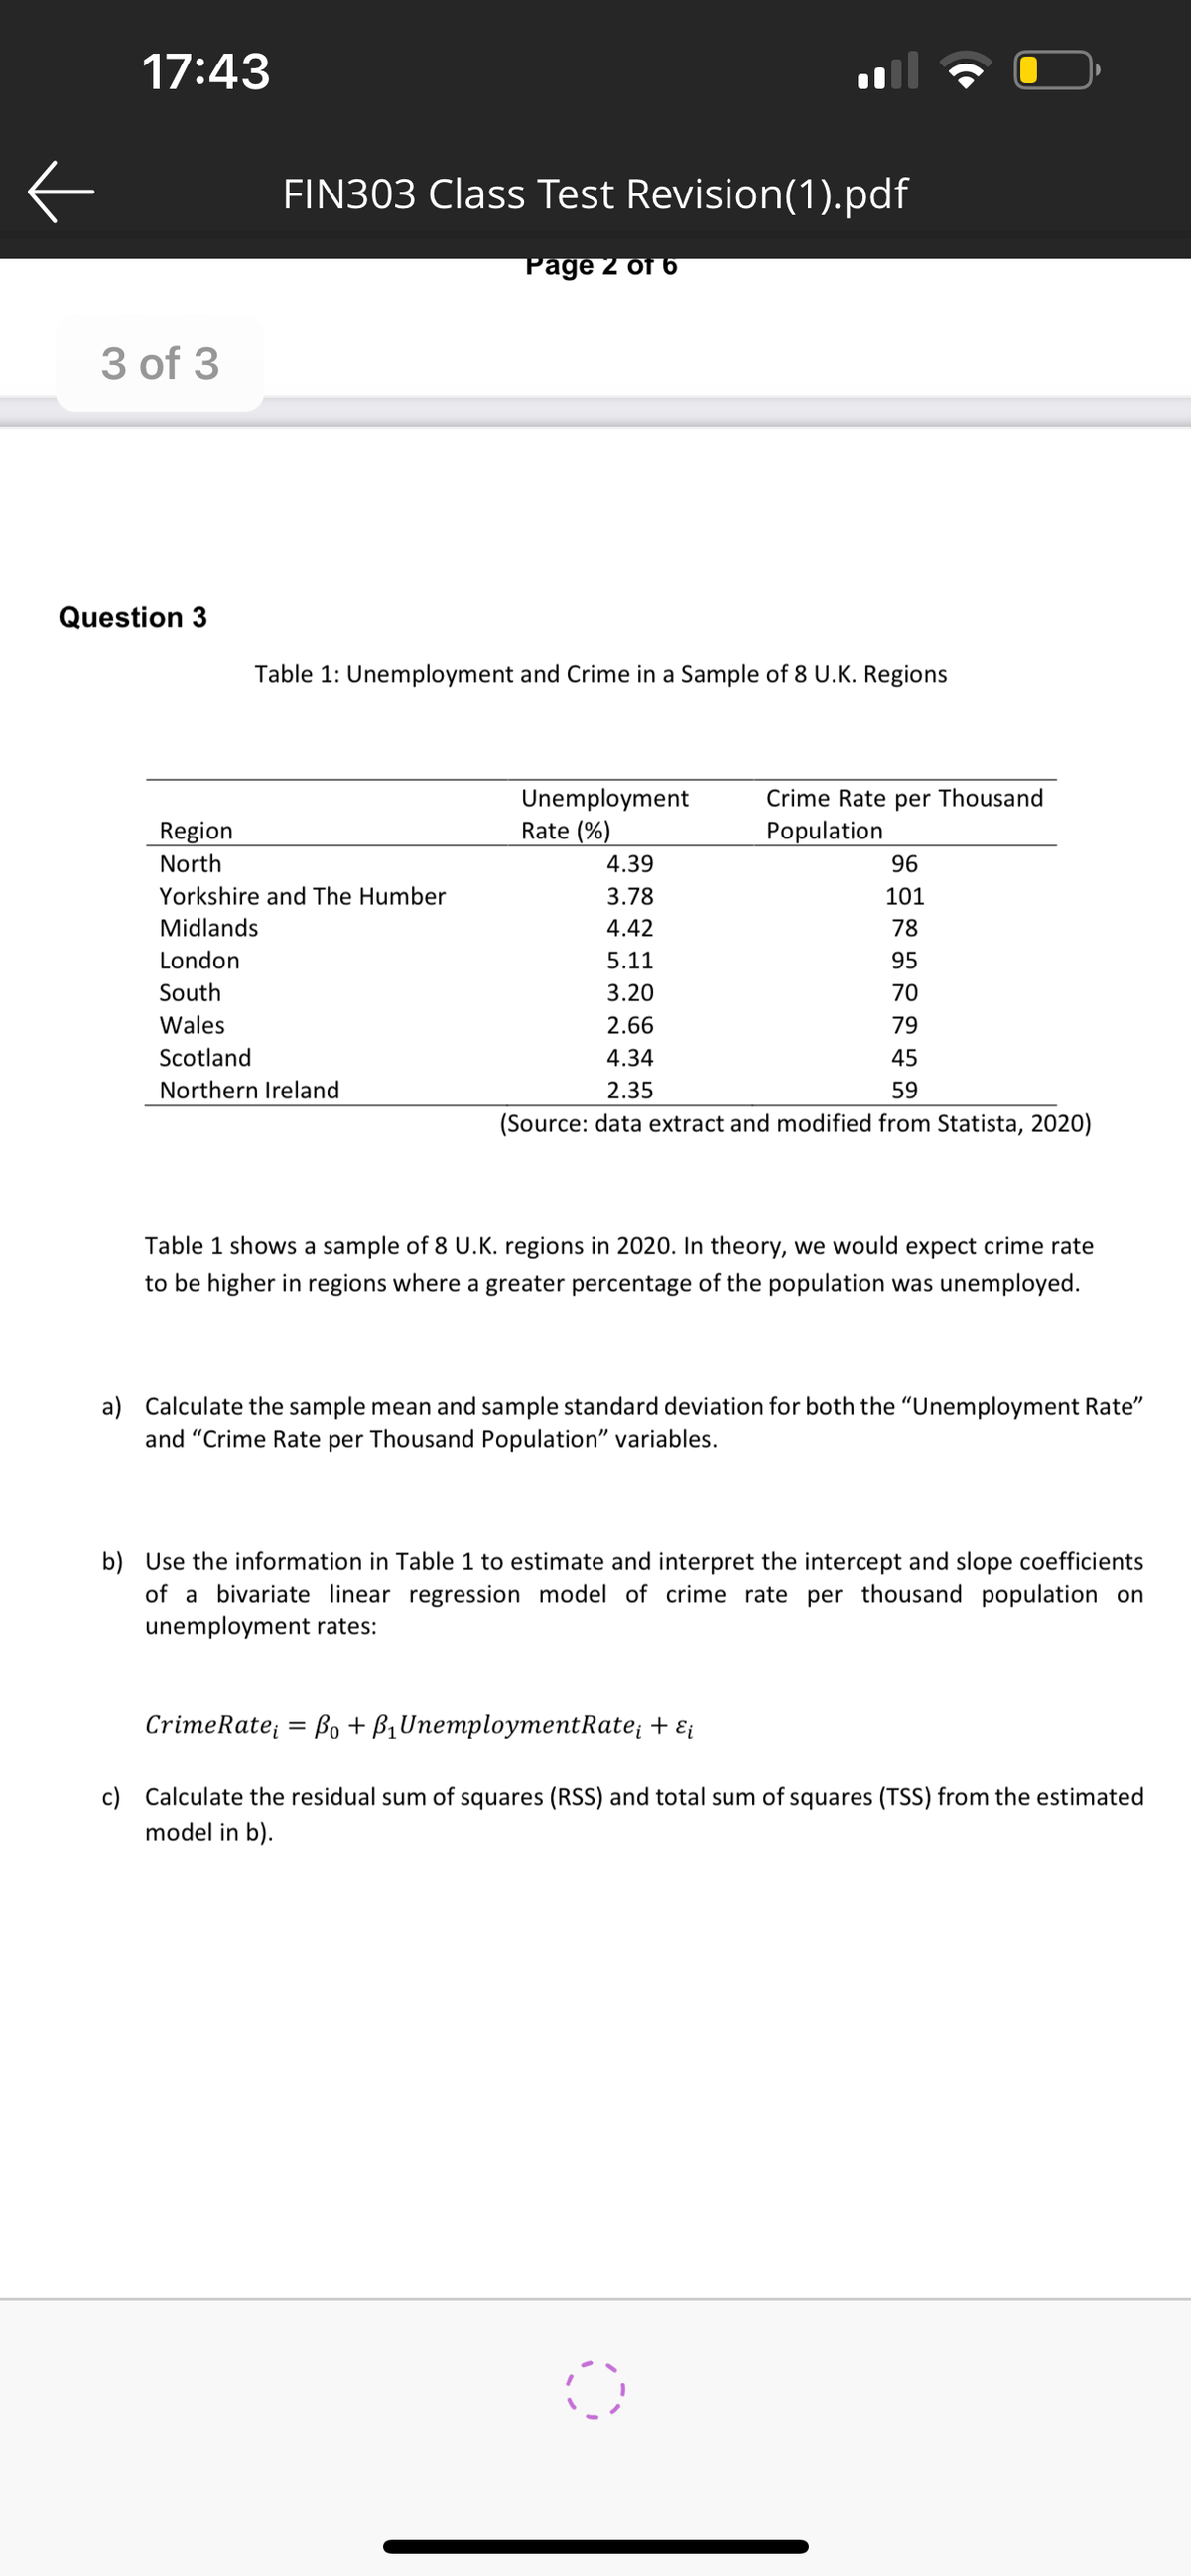
Table 1: Unemployment and Crime in a Sample of 8 U.K. Regions
Yorkshire and The Humber
Midlands
London
South
Wales
Scotland
Northern Ireland
Unemployment
Rate (%)
4.39
3.78
4.42
5.11
3.20
2.66
4.34
2.35
96
101
78
95
70
79
45
59
(Source: data extract and modified from Statista, 2020)
Crime Rate per Thousand
Population
Table 1 shows a sample of 8 U.K. regions in 2020. In theory, we would expect crime rate
to be higher in regions where a greater percentage of the population was unemployed.
a) Calculate the sample mean and sample standard deviation for both the "Unemployment Rate"
and "Crime Rate per Thousand Population" variables.
b) Use the information in Table 1 to estimate and interpret the intercept and slope coefficients
of a bivariate linear regression model of crime rate per thousand population on
unemployment rates:
CrimeRate; Bo + B₁ UnemploymentRate; + εi
c) Calculate the residual sum of squares (RSS) and total sum of squares (TSS) from the estimated
model in b).
0
Expert Solution
This question has been solved!
Explore an expertly crafted, step-by-step solution for a thorough understanding of key concepts.

Step by step
Solved in 4 steps

Follow-up Questions
Read through expert solutions to related follow-up questions below.
Follow-up Question
For standard deviation, the x-x or the y-y, which numbers do you use?
Solution
Recommended textbooks for you
MATLAB: An Introduction with Applications
Statistics
ISBN:
9781119256830
Author:
Amos Gilat
Publisher:
John Wiley & Sons Inc

Probability and Statistics for Engineering and th…
Statistics
ISBN:
9781305251809
Author:
Jay L. Devore
Publisher:
Cengage Learning

Statistics for The Behavioral Sciences (MindTap C…
Statistics
ISBN:
9781305504912
Author:
Frederick J Gravetter, Larry B. Wallnau
Publisher:
Cengage Learning
MATLAB: An Introduction with Applications
Statistics
ISBN:
9781119256830
Author:
Amos Gilat
Publisher:
John Wiley & Sons Inc
Probability and Statistics for Engineering and th…
Statistics
ISBN:
9781305251809
Author:
Jay L. Devore
Publisher:
Cengage Learning
Statistics for The Behavioral Sciences (MindTap C…
Statistics
ISBN:
9781305504912
Author:
Frederick J Gravetter, Larry B. Wallnau
Publisher:
Cengage Learning

Elementary Statistics: Picturing the World (7th E…
Statistics
ISBN:
9780134683416
Author:
Ron Larson, Betsy Farber
Publisher:
PEARSON

The Basic Practice of Statistics
Statistics
ISBN:
9781319042578
Author:
David S. Moore, William I. Notz, Michael A. Fligner
Publisher:
W. H. Freeman

Introduction to the Practice of Statistics
Statistics
ISBN:
9781319013387
Author:
David S. Moore, George P. McCabe, Bruce A. Craig
Publisher:
W. H. Freeman