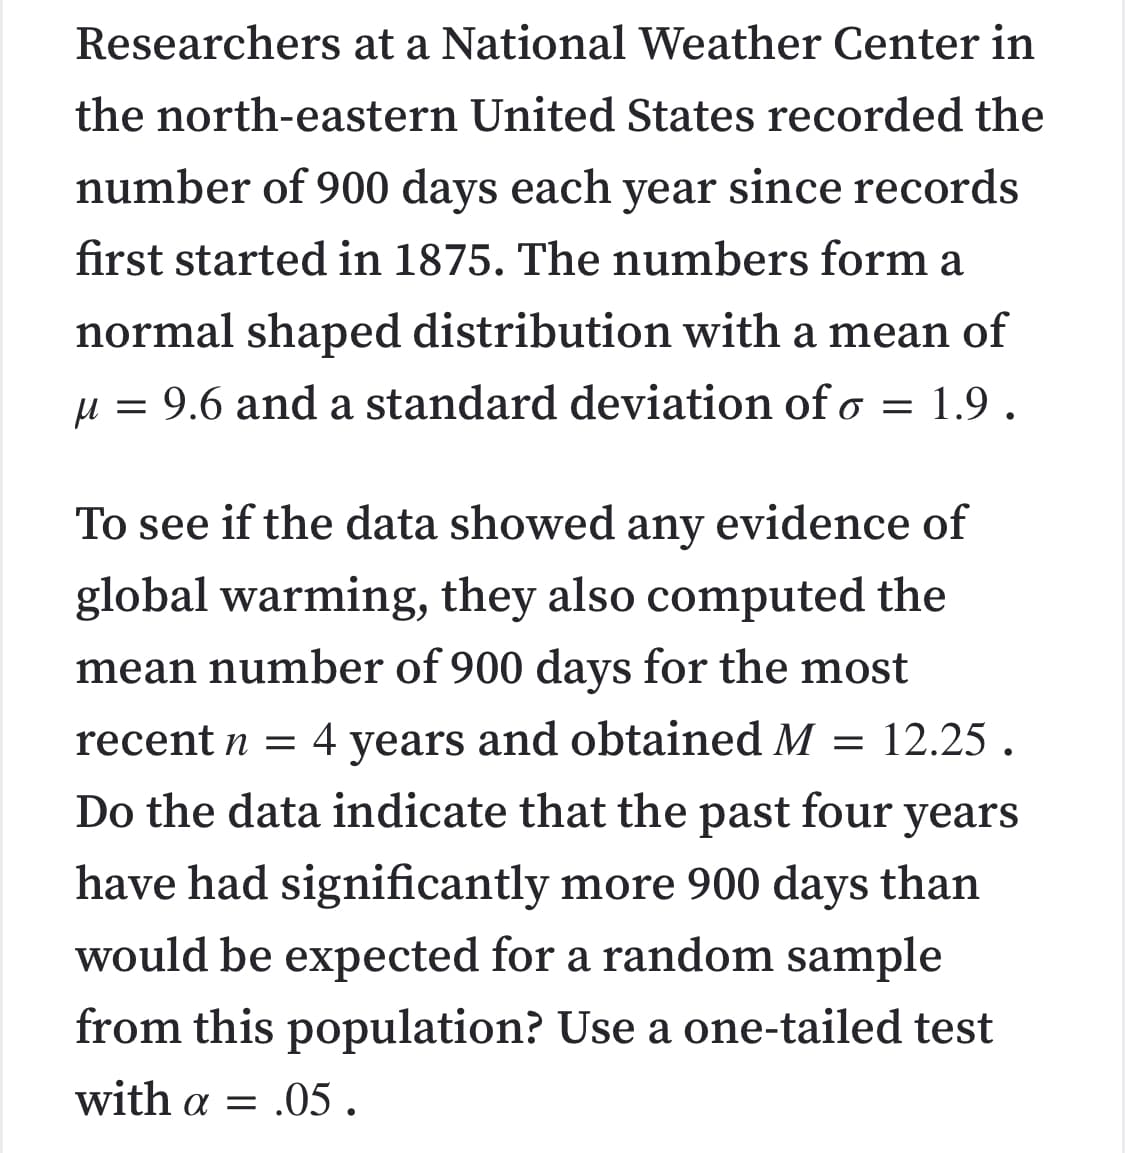
Researchers at a National Weather Center in the north-eastern United States recorded the number of 900 days each year since records first started in 1875. The numbers form a normal shaped distribution with a mean of µ = 9.6 and a standard deviation of o 1.9. To see if the data showed any evidence of global warming, they also computed the mean number of 900 days for the most years and obtained M = 12.25 . Do the data indicate that the past four years recent n = 4 have had significantly more 900 days than would be expected for a random sample from this population? Use a one-tailed test with a = .05.
Researchers at a National Weather Center in the north-eastern United States recorded the number of 900 days each year since records first started in 1875. The numbers form a normal shaped distribution with a mean of µ = 9.6 and a standard deviation of o 1.9. To see if the data showed any evidence of global warming, they also computed the mean number of 900 days for the most years and obtained M = 12.25 . Do the data indicate that the past four years recent n = 4 have had significantly more 900 days than would be expected for a random sample from this population? Use a one-tailed test with a = .05.

MATLAB: An Introduction with Applications
6th Edition
ISBN:9781119256830
Author:Amos Gilat
Publisher:Amos Gilat
Chapter1: Starting With Matlab
Section: Chapter Questions
Problem 1P

Related questions
Question
Transcribed Image Text:Researchers at a National Weather Center in
the north-eastern United States recorded the
number of 900 days each year since records
first started in 1875. The numbers form a
normal shaped distribution with a mean of
µ = 9.6 and a standard deviation of o
1.9.
To see if the data showed any evidence of
global warming, they also computed the
mean number of 900 days for the most
years and obtained M = 12.25 .
Do the data indicate that the past four years
recent n = 4
have had significantly more 900 days than
would be expected for a random sample
from this population? Use a one-tailed test
with a = .05.
Expert Solution
This question has been solved!
Explore an expertly crafted, step-by-step solution for a thorough understanding of key concepts.

This is a popular solution!

Trending now
This is a popular solution!

Step by step
Solved in 4 steps with 5 images

Recommended textbooks for you
MATLAB: An Introduction with Applications
Statistics
ISBN:
9781119256830
Author:
Amos Gilat
Publisher:
John Wiley & Sons Inc

Probability and Statistics for Engineering and th…
Statistics
ISBN:
9781305251809
Author:
Jay L. Devore
Publisher:
Cengage Learning

Statistics for The Behavioral Sciences (MindTap C…
Statistics
ISBN:
9781305504912
Author:
Frederick J Gravetter, Larry B. Wallnau
Publisher:
Cengage Learning
MATLAB: An Introduction with Applications
Statistics
ISBN:
9781119256830
Author:
Amos Gilat
Publisher:
John Wiley & Sons Inc
Probability and Statistics for Engineering and th…
Statistics
ISBN:
9781305251809
Author:
Jay L. Devore
Publisher:
Cengage Learning
Statistics for The Behavioral Sciences (MindTap C…
Statistics
ISBN:
9781305504912
Author:
Frederick J Gravetter, Larry B. Wallnau
Publisher:
Cengage Learning

Elementary Statistics: Picturing the World (7th E…
Statistics
ISBN:
9780134683416
Author:
Ron Larson, Betsy Farber
Publisher:
PEARSON

The Basic Practice of Statistics
Statistics
ISBN:
9781319042578
Author:
David S. Moore, William I. Notz, Michael A. Fligner
Publisher:
W. H. Freeman

Introduction to the Practice of Statistics
Statistics
ISBN:
9781319013387
Author:
David S. Moore, George P. McCabe, Bruce A. Craig
Publisher:
W. H. Freeman