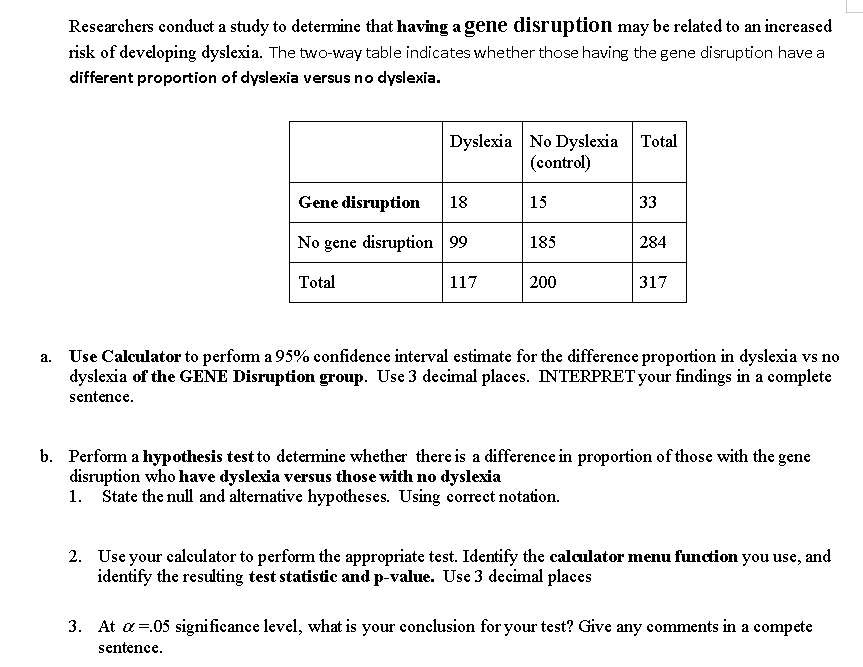
Researchers conduct a study to determine that having a gene disruption may be related to an increased risk of developing dyslexia. The two-way table indicates whether those having the gene disruption have a different proportion of dyslexia versus no dyslexia. Dyslexia No Dyslexia (control) Total Gene disruption 18 15 33 No gene disruption 99 185 284 Total 117 200 317 a. Use Calculator to perfom a 95% confidence interval estimate for the difference proportion in dyslexia vs no dyslexia of the GENE Disruption group. Use 3 decimal places. INTERPRET your findings in a complete sentence. b. Perform a hypothesis test to determine whether there is a difference in proportion of those with the gene disruption who have dyslexia versus those with no dyslexia 1. State the null and alternative hypotheses. Using correct notation. 2. Use your calculator to perform the appropriate test. Identify the calaulator menu function you use, and identify the resulting test statistic and p-value. Use 3 decimal places 3. At a=.05 signifieance level, what is your conelusion for your test? Give any comments in a compete sentence.
Researchers conduct a study to determine that having a gene disruption may be related to an increased risk of developing dyslexia. The two-way table indicates whether those having the gene disruption have a different proportion of dyslexia versus no dyslexia. Dyslexia No Dyslexia (control) Total Gene disruption 18 15 33 No gene disruption 99 185 284 Total 117 200 317 a. Use Calculator to perfom a 95% confidence interval estimate for the difference proportion in dyslexia vs no dyslexia of the GENE Disruption group. Use 3 decimal places. INTERPRET your findings in a complete sentence. b. Perform a hypothesis test to determine whether there is a difference in proportion of those with the gene disruption who have dyslexia versus those with no dyslexia 1. State the null and alternative hypotheses. Using correct notation. 2. Use your calculator to perform the appropriate test. Identify the calaulator menu function you use, and identify the resulting test statistic and p-value. Use 3 decimal places 3. At a=.05 signifieance level, what is your conelusion for your test? Give any comments in a compete sentence.

Glencoe Algebra 1, Student Edition, 9780079039897, 0079039898, 2018
18th Edition
ISBN:9780079039897
Author:Carter
Publisher:Carter
Chapter10: Statistics
Section10.6: Summarizing Categorical Data
Problem 10CYU

Related questions
Question
Transcribed Image Text:Researchers conduct a study to determine that having a gene disruption may be related to an increased
risk of developing dyslexia. The two-way table indicates whether those having the gene disruption have a
different proportion of dyslexia versus no dyslexia.
Dyslexia No Dyslexia Total
(control)
Gene disruption
18
15
33
No gene disruption 99
185
284
Total
117
200
317
a. Use Calculator to perfom a 95% confidence interval estimate for the difference proportion in dyslexia vs no
dyslexia of the GENE Disruption group. Use 3 decimal places. INTERPRET your findings in a complete
sentence.
b. Perform a hypothesis test to determine whether there is a difference in proportion of those with the gene
disruption who have dyslexia versus those with no dyslexia
1. State the null and alternative hypotheses. Using correct notation.
2. Use your caleulator to perform the appropriate test. Identify the caloaulator menu function you use, and
identify the resulting test statistic and p-value. Use 3 decimal places
3. At a=.05 significance level, what is your conclusion for your test? Give any comments in a compete
sentence.
Expert Solution
This question has been solved!
Explore an expertly crafted, step-by-step solution for a thorough understanding of key concepts.

This is a popular solution!

Trending now
This is a popular solution!

Step by step
Solved in 2 steps with 2 images

Recommended textbooks for you
Glencoe Algebra 1, Student Edition, 9780079039897…
Algebra
ISBN:
9780079039897
Author:
Carter
Publisher:
McGraw Hill

Holt Mcdougal Larson Pre-algebra: Student Edition…
Algebra
ISBN:
9780547587776
Author:
HOLT MCDOUGAL
Publisher:
HOLT MCDOUGAL

Big Ideas Math A Bridge To Success Algebra 1: Stu…
Algebra
ISBN:
9781680331141
Author:
HOUGHTON MIFFLIN HARCOURT
Publisher:
Houghton Mifflin Harcourt
Glencoe Algebra 1, Student Edition, 9780079039897…
Algebra
ISBN:
9780079039897
Author:
Carter
Publisher:
McGraw Hill
Holt Mcdougal Larson Pre-algebra: Student Edition…
Algebra
ISBN:
9780547587776
Author:
HOLT MCDOUGAL
Publisher:
HOLT MCDOUGAL
Big Ideas Math A Bridge To Success Algebra 1: Stu…
Algebra
ISBN:
9781680331141
Author:
HOUGHTON MIFFLIN HARCOURT
Publisher:
Houghton Mifflin Harcourt