Listed below are the numbers of triplets born in a country each year beginning with 1995. Is there a trend? The first year is given in the top left, and the years increase by 1 trom let to right. 4597 5302 6050 6796 6745 6825 6749 6830 7043 O 6828 6017 6217 5806 5739 5776 5185 5194 4422 Choose the correct time-series graph below O A. OB. Oc. OD. 8000 600- 4000- 2000- 8000 8000 6000- 8000 6000- 6000- 4000 4000- 4000- 2000- E2000 2000- 2000- 1994 2014 1994 2014 1904 2014 1994 2014 Year Year Year Year Comment on any trends. Choose the correct comment below. O A. There was a steep increase over the first four years, which leveled out for a few years before the number of triplets began to show a decreasing trend. O B. There was an increasing trend for about 10 years, after which the trend became approximately level. There was a substantial decreasing trend in the last few years. O c. The data show a rapidly increasing trend, which levels out for about 10 years, and then rapidly decreases. O D. The data show a slowly increasing and then slowly decreasing trend. Tet Bt
Listed below are the numbers of triplets born in a country each year beginning with 1995. Is there a trend? The first year is given in the top left, and the years increase by 1 trom let to right. 4597 5302 6050 6796 6745 6825 6749 6830 7043 O 6828 6017 6217 5806 5739 5776 5185 5194 4422 Choose the correct time-series graph below O A. OB. Oc. OD. 8000 600- 4000- 2000- 8000 8000 6000- 8000 6000- 6000- 4000 4000- 4000- 2000- E2000 2000- 2000- 1994 2014 1994 2014 1904 2014 1994 2014 Year Year Year Year Comment on any trends. Choose the correct comment below. O A. There was a steep increase over the first four years, which leveled out for a few years before the number of triplets began to show a decreasing trend. O B. There was an increasing trend for about 10 years, after which the trend became approximately level. There was a substantial decreasing trend in the last few years. O c. The data show a rapidly increasing trend, which levels out for about 10 years, and then rapidly decreases. O D. The data show a slowly increasing and then slowly decreasing trend. Tet Bt

MATLAB: An Introduction with Applications
6th Edition
ISBN:9781119256830
Author:Amos Gilat
Publisher:Amos Gilat
Chapter1: Starting With Matlab
Section: Chapter Questions
Problem 1P

Related questions
Question
42
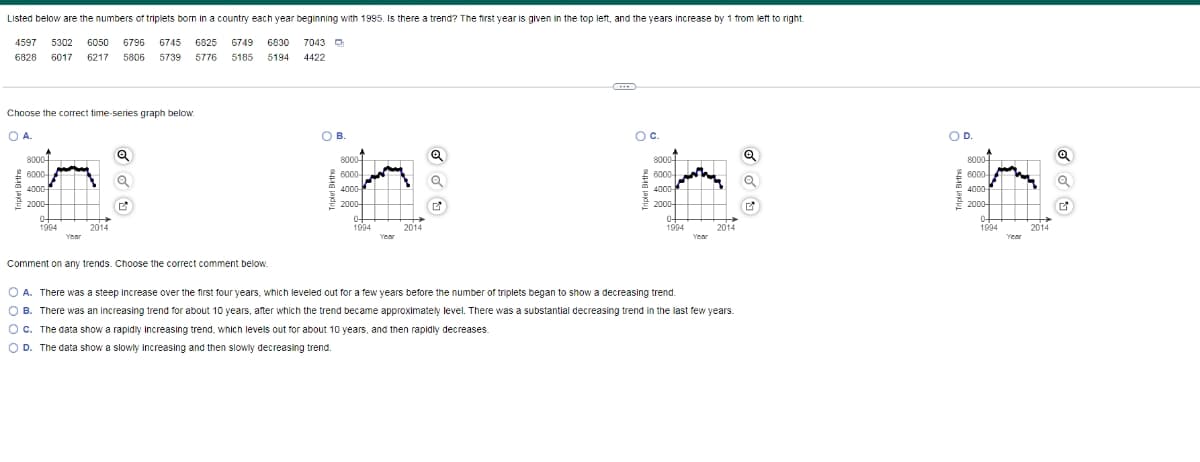
Transcribed Image Text:Listed below are the numbers of triplets born in a country each year beginning with 1995. Is there a trend? The first year is given in the top left, and the years increase by 1 from left to right.
4597 5302
6050
6796
6745
6825
6749
6830
7043 O
6828
6017
6217
5806
5739
5776
5185
5194
4422
Choose the correct time-series graph below.
OA.
O B.
В.
Oc.
OD.
8000
8000
2 6000-
4000
E
8000
8000
6000-
6000-
6000-
4000
4000
4000-
E
2000-
2000-
2000-
2000-
1994
2014
1994
2014
1994
2014
1994
2014
Year
Year
Year
Year
Comment on any trends. Choose the correct comment below.
O A. There was a steep increase over the first four years, which leveled out for a few years before the number of triplets began to show a decreasing trend.
O B. There was an increasing trend for about 10 years, after which the trend became approximately level. There was a substantial decreasing trend in the last few years.
c. The data show a rapidly increasing trend, which levels out for about 10 years, and then rapidly decreases.
D. The data show a slowly increasing and then slowly decreasing trend.
sng jaydu
Expert Solution
This question has been solved!
Explore an expertly crafted, step-by-step solution for a thorough understanding of key concepts.

This is a popular solution!

Trending now
This is a popular solution!

Step by step
Solved in 3 steps with 4 images

Recommended textbooks for you
MATLAB: An Introduction with Applications
Statistics
ISBN:
9781119256830
Author:
Amos Gilat
Publisher:
John Wiley & Sons Inc

Probability and Statistics for Engineering and th…
Statistics
ISBN:
9781305251809
Author:
Jay L. Devore
Publisher:
Cengage Learning

Statistics for The Behavioral Sciences (MindTap C…
Statistics
ISBN:
9781305504912
Author:
Frederick J Gravetter, Larry B. Wallnau
Publisher:
Cengage Learning
MATLAB: An Introduction with Applications
Statistics
ISBN:
9781119256830
Author:
Amos Gilat
Publisher:
John Wiley & Sons Inc
Probability and Statistics for Engineering and th…
Statistics
ISBN:
9781305251809
Author:
Jay L. Devore
Publisher:
Cengage Learning
Statistics for The Behavioral Sciences (MindTap C…
Statistics
ISBN:
9781305504912
Author:
Frederick J Gravetter, Larry B. Wallnau
Publisher:
Cengage Learning

Elementary Statistics: Picturing the World (7th E…
Statistics
ISBN:
9780134683416
Author:
Ron Larson, Betsy Farber
Publisher:
PEARSON

The Basic Practice of Statistics
Statistics
ISBN:
9781319042578
Author:
David S. Moore, William I. Notz, Michael A. Fligner
Publisher:
W. H. Freeman

Introduction to the Practice of Statistics
Statistics
ISBN:
9781319013387
Author:
David S. Moore, George P. McCabe, Bruce A. Craig
Publisher:
W. H. Freeman