resting heart rate depends upon your age and activity level, but generally a resting heart rate of 60-100 beats per minute (BPM) is considered to be a normal range for a healthy adult. After sitting half-way through an introductory statistics class session, a group of students measured their heart rates. This group of students is considered to be representative of students attending the same college. We will investigate whether introductory students at this college have heart rates in the normal adult range and because sitting in class is not exactly resting, let's posit that 80 BPM is a reasonable resting pulse rate to expect. A one-sample t test will be used on a subset of the data to determine whether introductory statistics students at this college have an average heart rate of 80 BPM after sitting halfway through class. Use a significance level of a- 0.05. The first five rows of the data look like this. Gender BPM Female 54 Female 60 Female 48 Female 48 Male 66 Import the dataset into SALT for analyzing. A USE SALT ter you have clicked the tab for your selected topic and read the problem, answer the questions below. »» Use SALT to summarize the data and fill in the following table, rounding values to four decimal places as needed. Sample Size Standard deviation Mean Variable We need to verify the assumptions for using the one-sample t test before analyzing this dataset. First the observations in the sample must be randomly selected from the population or the sample should be selected in such a way that the sample is representative of the population. Based on what is known about how this sample was collected, the first assumption Second, the sample size generally should be 30 or larger. Based on the sample size, the second assumption Select v met. : ) write the hypotheses below. (Enter - for + as needed.) Hạ: 1) Use SALT to perform the One Sample t test. Enter the requested values below. Round your standard error to three decimal places and your test statistic to two decimal places. Standard Error: Test Statistic: Degrees of Freedom: p.value: --Select-- ) Comparing the P-value with the significance level of 0.05, the P-value is -Select-- v the significance level. The decision is to -Select--- ♥ the null hypothesis. Based on the sample data, there Select v convincing evidence that our sample's mean differs from our hypothesized population mean by more than what could have resulted from sampling error alone.
resting heart rate depends upon your age and activity level, but generally a resting heart rate of 60-100 beats per minute (BPM) is considered to be a normal range for a healthy adult. After sitting half-way through an introductory statistics class session, a group of students measured their heart rates. This group of students is considered to be representative of students attending the same college. We will investigate whether introductory students at this college have heart rates in the normal adult range and because sitting in class is not exactly resting, let's posit that 80 BPM is a reasonable resting pulse rate to expect. A one-sample t test will be used on a subset of the data to determine whether introductory statistics students at this college have an average heart rate of 80 BPM after sitting halfway through class. Use a significance level of a- 0.05. The first five rows of the data look like this. Gender BPM Female 54 Female 60 Female 48 Female 48 Male 66 Import the dataset into SALT for analyzing. A USE SALT ter you have clicked the tab for your selected topic and read the problem, answer the questions below. »» Use SALT to summarize the data and fill in the following table, rounding values to four decimal places as needed. Sample Size Standard deviation Mean Variable We need to verify the assumptions for using the one-sample t test before analyzing this dataset. First the observations in the sample must be randomly selected from the population or the sample should be selected in such a way that the sample is representative of the population. Based on what is known about how this sample was collected, the first assumption Second, the sample size generally should be 30 or larger. Based on the sample size, the second assumption Select v met. : ) write the hypotheses below. (Enter - for + as needed.) Hạ: 1) Use SALT to perform the One Sample t test. Enter the requested values below. Round your standard error to three decimal places and your test statistic to two decimal places. Standard Error: Test Statistic: Degrees of Freedom: p.value: --Select-- ) Comparing the P-value with the significance level of 0.05, the P-value is -Select-- v the significance level. The decision is to -Select--- ♥ the null hypothesis. Based on the sample data, there Select v convincing evidence that our sample's mean differs from our hypothesized population mean by more than what could have resulted from sampling error alone.

Glencoe Algebra 1, Student Edition, 9780079039897, 0079039898, 2018
18th Edition
ISBN:9780079039897
Author:Carter
Publisher:Carter
Chapter10: Statistics
Section10.4: Distributions Of Data
Problem 22PFA

Related questions
Question
ch10 q17
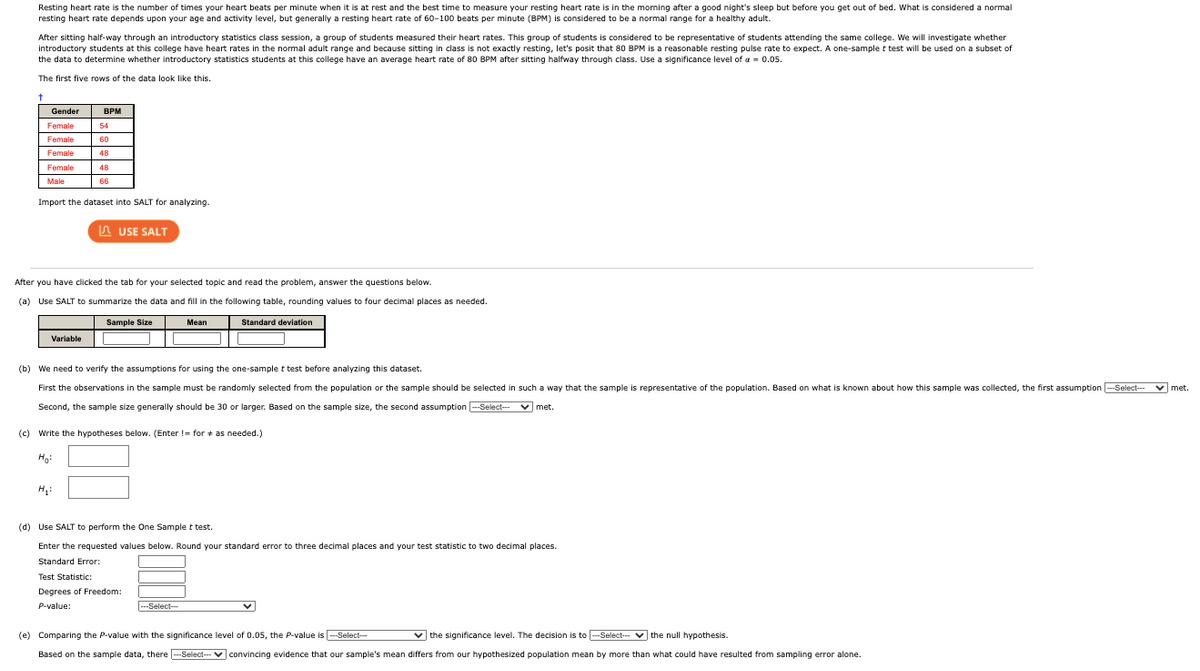
Transcribed Image Text:Resting heart rate is the number of times your heart beats per minute when it is at rest and the best time to measure your resting heart rate is in the morning after a good night's sleep but before you get out of bed. What is considered a normal
resting heart rate depends upon your age and activity level, but generally a resting heart rate of 60-100 beats per minute (BPM) is considered to be a normal range for a healthy adult.
After sitting half-way through an introductory statistics class session, a group of students measured their heart rates. This group of students is considered to be representative of students attending the same college. We will investigate whether
introductory students at this college have heart rates in the normal adult range and because sitting in class is not exactly resting, let's posit that 80 BPM is a reasonable resting pulse rate to expect. A one-sample t test will be used on a subset of
the data to determine whether introductory statistics students at this college have an average heart rate of 80 BPM after sitting halfway through class. Use a significance level of a = 0.05.
The first five rows of the data look like this.
to
Gender
BPM
Female
54
Female
60
Female
48
Female
48
Male
66
Import the dataset into SALT for analyzing.
A USE SALT
After you have clicked the tab for your selected topic and read the problem, answer the questions below.
(a) Use SALT to summarize the data and fill in the following table, rounding values to four decimal places as needed.
Sample Size
Mean
Standard deviation
Variable
(b) We need to verify the assumptions for using the one-sample t test before analyzing this dataset.
First the observations in the sample must be randomly selected from the population or the sample should be selected in such a way that the sample is representative of the population. Based on what is known about how this sample was collected, the first assumption --Select-- v met.
Second, the sample size generally should be 30 or larger. Based on the sample size, the second assumption -Select- v met.
(c) Write the hypotheses below. (Enter != for + as needed.)
Ho:
(d) Use SALT to perform the One Sample t test.
Enter the requested values below. Round your standard error to three decimal places and your test statistic to two decimal places.
Standard Error:
Test Statistic:
Degrees of Freedom:
P-value:
---Select--
(e) Comparing the P-value with the significance level of 0.05, the P-value is -Select-
v the significance level. The decision is to -Select-- v the null hypothesis.
Based on the sample data, there --Select- V convincing evidence that our sample's mean differs from our hypothesized population mean by more than what could have resulted from sampling error alone.
Expert Solution
This question has been solved!
Explore an expertly crafted, step-by-step solution for a thorough understanding of key concepts.

Step by step
Solved in 3 steps with 3 images

Recommended textbooks for you
Glencoe Algebra 1, Student Edition, 9780079039897…
Algebra
ISBN:
9780079039897
Author:
Carter
Publisher:
McGraw Hill

Holt Mcdougal Larson Pre-algebra: Student Edition…
Algebra
ISBN:
9780547587776
Author:
HOLT MCDOUGAL
Publisher:
HOLT MCDOUGAL

Big Ideas Math A Bridge To Success Algebra 1: Stu…
Algebra
ISBN:
9781680331141
Author:
HOUGHTON MIFFLIN HARCOURT
Publisher:
Houghton Mifflin Harcourt
Glencoe Algebra 1, Student Edition, 9780079039897…
Algebra
ISBN:
9780079039897
Author:
Carter
Publisher:
McGraw Hill
Holt Mcdougal Larson Pre-algebra: Student Edition…
Algebra
ISBN:
9780547587776
Author:
HOLT MCDOUGAL
Publisher:
HOLT MCDOUGAL
Big Ideas Math A Bridge To Success Algebra 1: Stu…
Algebra
ISBN:
9781680331141
Author:
HOUGHTON MIFFLIN HARCOURT
Publisher:
Houghton Mifflin Harcourt