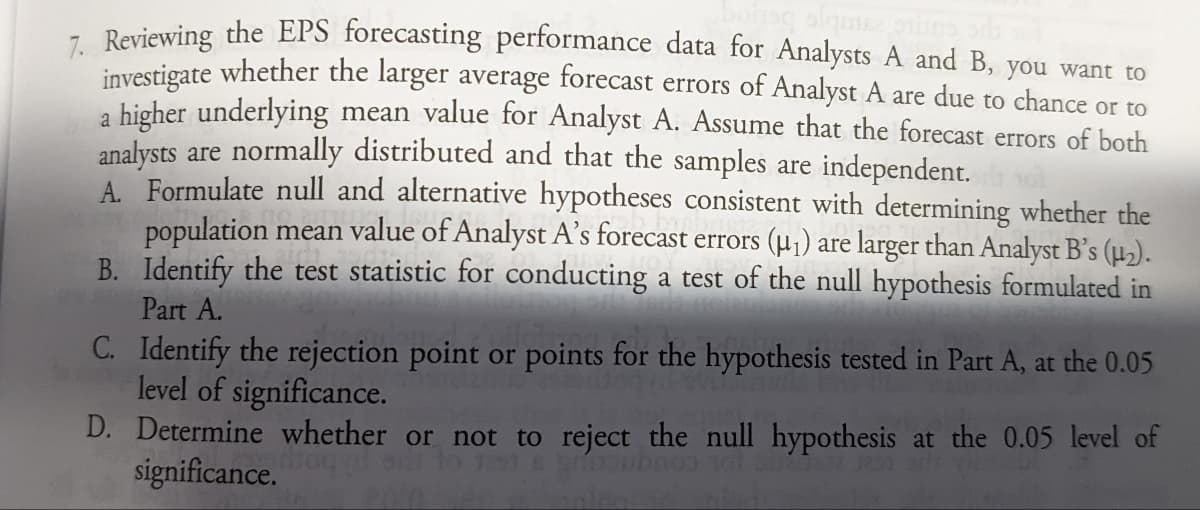
- Reviewing the EPS forecasting performance data for Analysts A and B, you want to investigate whether the larger average forecast errors of Analyst A are due to chance or to a higher underlying mean value for Analyst A. Assume that the forecast errors of both analysts are normally distributed and that the samples are independent. A. Formulate null and alternative hypotheses consistent with determining whether the population mean value of Analyst A's forecast errors (µ1) are larger than Analyst B's (µ2). B. Identify the test statistic for conducting a test of the null hypothesis formulated in Part A. C. Identify the rejection point or points for the hypothesis tested in Part A, at the 0.05 level of significance.
- Reviewing the EPS forecasting performance data for Analysts A and B, you want to investigate whether the larger average forecast errors of Analyst A are due to chance or to a higher underlying mean value for Analyst A. Assume that the forecast errors of both analysts are normally distributed and that the samples are independent. A. Formulate null and alternative hypotheses consistent with determining whether the population mean value of Analyst A's forecast errors (µ1) are larger than Analyst B's (µ2). B. Identify the test statistic for conducting a test of the null hypothesis formulated in Part A. C. Identify the rejection point or points for the hypothesis tested in Part A, at the 0.05 level of significance.

Glencoe Algebra 1, Student Edition, 9780079039897, 0079039898, 2018
18th Edition
ISBN:9780079039897
Author:Carter
Publisher:Carter
Chapter10: Statistics
Section10.4: Distributions Of Data
Problem 19PFA

Related questions
Question
Transcribed Image Text:- Reviewing the EPS forecasting performance data for Analysts A and B, you want to
investigate whether the larger average forecast errors of Analyst A are due to chance or to
a higher underlying mean value for Analyst A. Assume that the forecast errors of both
analysts are normally distributed and that the samples are independent.
A. Formulate null and alternative hypotheses consistent with determining whether the
population mean value of Analyst A's forecast errors (µ1) are larger than Analyst B's ().
B. Identify the test statistic for conducting a test of the null hypothesis formulated in
Part A.
C. Identify the rejection point or points for the hypothesis tested in Part A, at the 0.05
level of significance.
D. Determine whether or not to reject the null hypothesis at the 0.05 level of
significance.
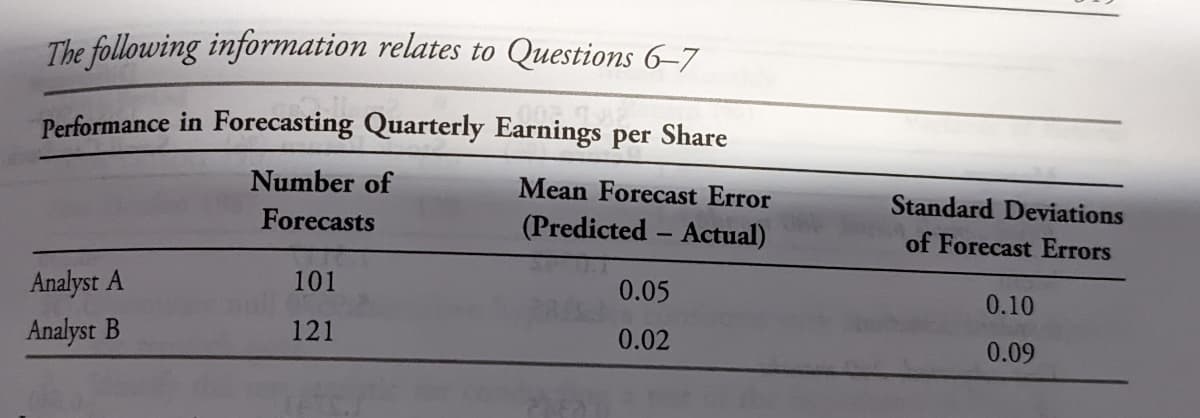
Transcribed Image Text:The following information relates to Questions 6–7
Performance in Forecasting Quarterly Earnings per Share
Number of
Mean Forecast Error
Standard Deviations
Forecasts
(Predicted - Actual)
of Forecast Errors
Analyst A
101
0.05
0.10
Analyst B
121
0.02
0.09
Expert Solution
Step 1
Since we only answer up to 3 sub-parts, we’ll answer the first 3. Please resubmit the question and specify the other subparts (up to 3) you’d like answered.

Trending now
This is a popular solution!

Step by step
Solved in 2 steps

Recommended textbooks for you
Glencoe Algebra 1, Student Edition, 9780079039897…
Algebra
ISBN:
9780079039897
Author:
Carter
Publisher:
McGraw Hill
Glencoe Algebra 1, Student Edition, 9780079039897…
Algebra
ISBN:
9780079039897
Author:
Carter
Publisher:
McGraw Hill