A study was done on proctored and nonproctored tests. The results are shown in the table. Assume that the two samples are independent simple random samples selected from normally distributed populations, and do not assume that the population standard deviations are equal. Complete parts (a) and (b) below. Proctored Nonproctored H1 H2 n 32 35 74.73 81.73 10.12 22.49 a. Use a 0.01 significance level to test the claim that students taking nonproctored tests get a higher mean score than those taking proctored tests. What are the null and alternative hypotheses? O A. Ho: H1 = H2 H: H1 > H2 B. Họ: H1H2 OC. Ho: H1 = H2 H,: H1 H2 O D. Họ:Hy #H2 H,: H
A study was done on proctored and nonproctored tests. The results are shown in the table. Assume that the two samples are independent simple random samples selected from normally distributed populations, and do not assume that the population standard deviations are equal. Complete parts (a) and (b) below. Proctored Nonproctored H1 H2 n 32 35 74.73 81.73 10.12 22.49 a. Use a 0.01 significance level to test the claim that students taking nonproctored tests get a higher mean score than those taking proctored tests. What are the null and alternative hypotheses? O A. Ho: H1 = H2 H: H1 > H2 B. Họ: H1H2 OC. Ho: H1 = H2 H,: H1 H2 O D. Họ:Hy #H2 H,: H

MATLAB: An Introduction with Applications
6th Edition
ISBN:9781119256830
Author:Amos Gilat
Publisher:Amos Gilat
Chapter1: Starting With Matlab
Section: Chapter Questions
Problem 1P

Related questions

Question
1) Provide test statistic (round to 3 decimal places)
2) Provide P Value (round to 3 decimal places)
3) State conclusion
4) Construct a confidence interval that is suitable for testing that the students taking non-proctored tests have a higher mean score (u1-u2)
5) Does the interval support the test?
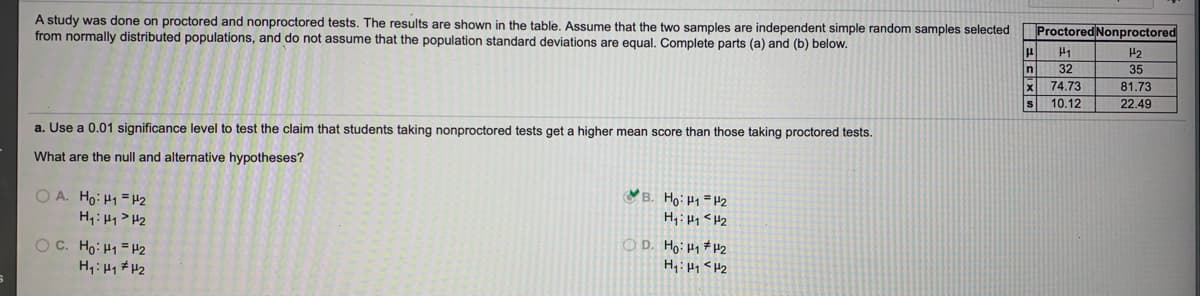
Transcribed Image Text:A study was done on proctored and nonproctored tests. The results are shown in the table, Assume that the two samples are independent simple random samples selected
from normally distributed populations, and do not assume that the population standard deviations are equal. Complete parts (a) and (b) below.
Proctored Nonproctored
H2
32
35
74.73
81.73
10.12
22.49
a. Use a 0.01 significance level to test the claim that students taking nonproctored tests get a higher mean score than those taking proctored tests.
What are the null and alternative hypotheses?
OA. Ho: H1 = 2
H: H1> H2
VB. Ho: P1=#2
O D. Ho:Hy #H2
OC. Ho: H1 = H2
H: H1 # H2
Expert Solution
This question has been solved!
Explore an expertly crafted, step-by-step solution for a thorough understanding of key concepts.

Step by step
Solved in 3 steps with 3 images

Knowledge Booster


Learn more about
Need a deep-dive on the concept behind this application? Look no further. Learn more about this topic, statistics and related others by exploring similar questions and additional content below.Recommended textbooks for you
MATLAB: An Introduction with Applications
Statistics
ISBN:
9781119256830
Author:
Amos Gilat
Publisher:
John Wiley & Sons Inc

Probability and Statistics for Engineering and th…
Statistics
ISBN:
9781305251809
Author:
Jay L. Devore
Publisher:
Cengage Learning

Statistics for The Behavioral Sciences (MindTap C…
Statistics
ISBN:
9781305504912
Author:
Frederick J Gravetter, Larry B. Wallnau
Publisher:
Cengage Learning
MATLAB: An Introduction with Applications
Statistics
ISBN:
9781119256830
Author:
Amos Gilat
Publisher:
John Wiley & Sons Inc
Probability and Statistics for Engineering and th…
Statistics
ISBN:
9781305251809
Author:
Jay L. Devore
Publisher:
Cengage Learning
Statistics for The Behavioral Sciences (MindTap C…
Statistics
ISBN:
9781305504912
Author:
Frederick J Gravetter, Larry B. Wallnau
Publisher:
Cengage Learning

Elementary Statistics: Picturing the World (7th E…
Statistics
ISBN:
9780134683416
Author:
Ron Larson, Betsy Farber
Publisher:
PEARSON

The Basic Practice of Statistics
Statistics
ISBN:
9781319042578
Author:
David S. Moore, William I. Notz, Michael A. Fligner
Publisher:
W. H. Freeman

Introduction to the Practice of Statistics
Statistics
ISBN:
9781319013387
Author:
David S. Moore, George P. McCabe, Bruce A. Craig
Publisher:
W. H. Freeman