Rhenz scored 32 points on their Math summative test. The following data are the summative test scores of Grade 10 Competence in Math. He wants to identify the percentage of his score among the class' scores. Construct a frequency distribution table. Interpret results and formulate conclusion. Compute the percentile rank of grouped data. Use the formula below. (Ctrl) - 30 25 13 31 18 36 30 32 17 30 9 11 37 35 30 25 5 36 36 31 13 27 5 12 5 36 35 8 6 35 30 26 24 10 18 36 44 33 5 17 36 35 [(P-LB) fp PPR = [100] { where: PR percentile rank, the answer will be a percentage Praw score or value for which one wants to find a Percentile rank LB lower boundary of the kth percentile class N total frequency - cfp = cumulative frequency of all the values below the critical vahie
Rhenz scored 32 points on their Math summative test. The following data are the summative test scores of Grade 10 Competence in Math. He wants to identify the percentage of his score among the class' scores. Construct a frequency distribution table. Interpret results and formulate conclusion. Compute the percentile rank of grouped data. Use the formula below. (Ctrl) - 30 25 13 31 18 36 30 32 17 30 9 11 37 35 30 25 5 36 36 31 13 27 5 12 5 36 35 8 6 35 30 26 24 10 18 36 44 33 5 17 36 35 [(P-LB) fp PPR = [100] { where: PR percentile rank, the answer will be a percentage Praw score or value for which one wants to find a Percentile rank LB lower boundary of the kth percentile class N total frequency - cfp = cumulative frequency of all the values below the critical vahie

Glencoe Algebra 1, Student Edition, 9780079039897, 0079039898, 2018
18th Edition
ISBN:9780079039897
Author:Carter
Publisher:Carter
Chapter10: Statistics
Section10.4: Distributions Of Data
Problem 19PFA

Related questions
Question
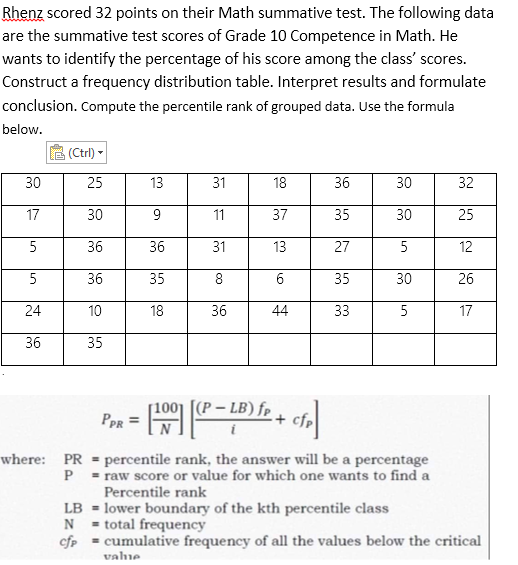
Transcribed Image Text:Rhenz scored 32 points on their Math summative test. The following data
are the summative test scores of Grade 10 Competence in Math. He
wants to identify the percentage of his score among the class' scores.
Construct a frequency distribution table. Interpret results and formulate
conclusion. Compute the percentile rank of grouped data. Use the formula
below.
(Ctrl)
30
13
31
18
36
30
32
17
9
11
37
35
30
25
5
36
31
13
27
5
12
5
35
8
6
35
30
26
24
18
36
44
33
5
17
36
-
PPR =
- [201²-
[(P - LB) fr + cfr
i
where: PR
percentile rank, the answer will be a percentage
P = raw score or value for which one wants to find a
Percentile rank
LB = lower boundary of the kth percentile class
N
total frequency
cfp = cumulative frequency of all the values below the critical
value
25
30
36
36
10
35
Expert Solution
This question has been solved!
Explore an expertly crafted, step-by-step solution for a thorough understanding of key concepts.

Step by step
Solved in 2 steps with 1 images

Recommended textbooks for you
Glencoe Algebra 1, Student Edition, 9780079039897…
Algebra
ISBN:
9780079039897
Author:
Carter
Publisher:
McGraw Hill
Glencoe Algebra 1, Student Edition, 9780079039897…
Algebra
ISBN:
9780079039897
Author:
Carter
Publisher:
McGraw Hill