Source of Variation df Treatment 4 Blocks 5 Error Total Is the F-ratio significant at the 0.05 level? Сл SS 140 200 550 MS F-Value
Q: In a sample of 800 randomly selected drivers, 12% of them say police stopped them in the past year.…
A: Given that Sample size n =800 Sample proportion p^=12%=0.12 Population proportion p=10.3%=0.103
Q: What is the value of Σ X?
A: It is given that X be the random variable that represents the percentage of successful free throws…
Q: Referring to Table 1, the null hypothesis should not be rejected: Question 4 options: 1) True…
A: Given:
Q: 6.50 How's it going?: The American National Election Studies (ANES) collects data on voter attitudes…
A: Given that
Q: ook Humor 51 3 7 5 Made Useful 64 54 61 Story Form 54 61 79 Problem 2 Based on a teaching experiment…
A: Given,
Q: TEEPTIONSITIP 5. Is there a reasonable agreement among the instructors in their judgment of the…
A: From the given information we find the solution.
Q: Q scores on the WAIS test approximate a normal curve with a mean of 100 and a standard deviation of…
A:
Q: study was conducted of 531 persons injured in bicycle crashes. The subjects were asked if they wore…
A: Given that We have to determine if there was a relationship between helmet wearing and the…
Q: As a Physical Education teacher of ADU, Sir Loui wants to compute for the Body Mass Index of few…
A: Given information: As a start, the following are the height of five students in meters. Jaeight-…
Q: Pixieedust Telecommunications, Inc has the following target capital structure, which it considers to…
A:
Q: A U.S. Web Usage Snapshot indicated a monthly average of 42.1 Internet visits per user from home. A…
A: Given: Hypothesis population mean=µ=42.1 Sample Mean (x¯)=36 Sample Standard…
Q: 3. Is there a relationship between the number of children respondents have ever had and the number…
A: Pearson correlation coefficient measures the strength and direction of relationship between two…
Q: specialist asked a random sample of 100 students from a secondary school the number of books they…
A: Given that Sample size n =100 there is a linear relationship between hours spent watching TV and…
Q: one-year rate moves up by 9e, and the movements in intermediate rates are calculated by…
A:
Q: Assume that 100 students are registered for the course. a) What is the probability that two or…
A: Let X be the number of students withdraw without completing the introductory business analytics…
Q: 7 The mean of the population and the mean of a sample are designated by the same symbol. True False…
A:
Q: If X is normally distributed random variable with a standard deviation of 35. Find the mean given…
A:
Q: The following data consists of a matrix of transition probabilities (P) of three competing…
A:
Q: A magazine reported that at the top 50 business schools in a region, students studied an average of…
A: Claim : The mean number of hours studied at your school is different from the reported 16.1 hour…
Q: Let p be the population proportion of correct polygraph results. Identify the null and alternative…
A:
Q: The daily dissolved oxygen concentration in a downstream from an industrial plant has been recorded…
A: The daily dissolved oxygen concentration in a downstream from an industrial plant has been recorded…
Q: According to The National newspaper, more than 80% of adults in the UAE are playing mobile games. In…
A: Solution: Given information: n= 256 Sample size of adults x= 231 adults play the mobile games…
Q: Suppose that a random sample of 9 adults has a mean score of 76 on a standardized personality test,…
A: Given Sample size n=9, sample mean x̄=76, sample standard deviations s=7, Level of significance…
Q: We want to conduct a hypothesis test of the claim that the population mean score on a nationwide…
A: Given Mean=485 Standard deviations=75
Q: PLEASE SHOW ALL NECESSARY WORKING 6. The table below shows the scores a class received on their…
A:
Q: In a chi-square test, if you are able to reject the null hypothesis at alpha = .05, you can…
A: Null hypothesis for chi-square test statistic is: H0: there is no association between the…
Q: 8. Show that the m.g.f. about the mean for a Poisson variate is exp {m (e-t-1). Obtain from this the…
A:
Q: The manager of a fleet automobiles is testing two brands of radial tires and assigns one tire of…
A: We use t-test statistic to compare means of two samples. H0: there is no difference between means of…
Q: west Wales was collected for different age groups. Do the data in the table show that the observed…
A:
Q: engineering
A: Correction: last term in the above image is σ/n
Q: QUESTION TWO. The marketing department of a major personal fragrance company was trying to ascertain…
A:
Q: How do you find the X value that corresponds to a given percentile of the normal distribution? Find…
A:
Q: (Yield Curve) The following are the Treasury yield curve data on October 15, 2023 (fictitious data)…
A:
Q: Suppose the following information is collected on an application for a loan. a. Current debt:…
A: Solution-: We classify the following responses by type of data (a) Current debt: $149,720 (b) Number…
Q: Show that for Poisson distribution with parameter m, all the cumulants are m.
A:
Q: 1. Ho:μ = 80 Ha: μ # 80 The sample mean is 83, the sample size is 39, and the standard deviation is…
A: Given that Sample size n =39 Sample mean =83 Standard deviation =5 NOTE:- According to bartleby…
Q: Let x be a random variable that represents the percentage of successful free throws a professional…
A: X: 71,65,62,90,73,71 Y: 59,51,60,74,86,88
Q: y that a randomly selected utility bill is less than $69 is ecimal places as needed.) y that a…
A: Given Mean =100 Standard deviation =12
Q: [B] If the population is finite in which sampling is without. replacement, then: Pq N-n Vp [² N:…
A: Given that We have to find that If the population is finite in which sampling is without…
Q: please do it in handwritten form
A:
Q: Direction: Determine the sample space and the event of the given experiment. 1) Toss two coins.…
A: The appropriate events are to be defined for the given cases, where a coin is tossed and a die is…
Q: REGRESSION ANALYSIS: DETECTION, EFFECTS AND REMEDIAL MEASURES OF DEPARTURES ON ASSUMPTIONS OF…
A:
Q: When would you use the Tukey-Kramer procedure? Question 1 options: to test independence of…
A: Tukey-Kramer procedure:
Q: After the premiere of the new comedy Bumblebee, moviegoers were asked in a quick poll whether they…
A: Solution: Given information: n= 20 number of adults x= 14 adults like the movie m= 100 number of…
Q: What is the value of xy?
A:
Q: The following is a set of data from a sample of n = 7. 4 8 16 3 1 16 20 (a) Compute the first…
A: Arranging the number is ascending order we get 1 3 4 8 16 16 20 The first quartile Q1 is 3 , The…
Q: Thanks
A:
Q: What is the value of y2²? Σ
A: It is given that x represents the sales in Php y represents the temperature on that day
Q: A businessman is considering investing in the small business. A random sample of 45 companies…
A: Givensample size(n)=45Mean(x)=6.4%=0.064standard deviation(s)=1.3%=0.013
Q: 7. A paper in Quality Engineering [2013, Vol. 25(1)] presented data on cycles to failure of solder…
A:
Complete the ANOVA Table by showing complete solutions and by solving manually (not excel or minitab).
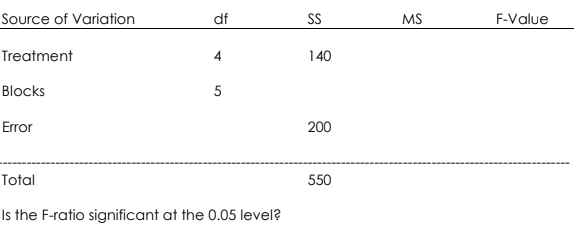
Step by step
Solved in 2 steps
- Can the average rate of change of a function be constant?The distribution of the height of males in the U.S. is roughly normally distributed with a mean of 70 inches and a standard deviation of 3 inches. (a) Draw a normal curve with the parameters labeled. (b) Shade the region on your drawing that represents the proportion of males in the U.S. that are 68 inches tall or taller. (c) Suppose the area under the normal curve to the right of x=74 is 0.0912. Provide two interpretations of this result.Find the area of the shaded region the graph to the right to pics IQ scores of adults and those scores are normally distributed with a mean of 100 and a standard deviation of 15.
- The "spring-like effect" in a golf club could be determined by measuring the coefficient of restitution (the ratio of the outbound velocity to the inbound velocity of a golf ball fired at the clubhead). Twelve randomly selected drivers produced by two clubmakers are tested and the coefficient of restitution measured. The data follow: Club 1: 0.8406, 0.8104, 0.8234, 0.8198, 0.8235, 0.8562, 0.8123, 0.7976, 0.8184, 0.8265, 0.7773, 0.7871 Club 2: 0.8305, 0.7905, 0.8352, 0.8380, 0.8145, 0.8465, 0.8244, 0.8014, 0.8309, 0.8405, 0.8256, 0.8476 Test the hypothesis that both brands of ball have equal mean overall distance. Use α = 0.05 and assume equal variances. Question: Reject H0 if t0 < ___ or if t0 > ___.The F-ratio is calculated by ______ different types of variability. dividing subtracting adding multiplyingFind the area of the shaded region. The graph to the right depicts IQ scores of adults, and those scores are normally distributed with a mean of 100 and a standard deviation of 15. Given points: between 102 and 124 are shaded.
- Describe the standard error of the point estimate S, and what it means? (for standard variation of your population)Dr. Johnson is interested in the difference in mean systolic blood pressure between groups. He performs analysis and finds a mean difference of 0.0005 mmHg in systolic blood pressure with a p value of 0.001. Dr. Johnson's findings are: a) statistically insignificant and practically significant b) statistically significant and practically significant c) statistically insignificant and practically insignificant d) statistically significant but practically insAbout ______% of the area is between z= -1 and z= 1 (or within 1 standard deviations of the mean).
- The IDOLE Company has two assembly lines in its Hamburg plant. Line A produces an average of 335 units per day with a standard deviation equal to 11units. Line B produces an average of 145 units per day with a standard deviation equal to 8 units. Based on this information using the coefficient of variation determine which line is relatively more consistent? Explain the answer by the information given and through the calculations involved in arriving at the answer.The height of waste bin manufactured by a factory for a garden have a normal distribution with mean as 1.25 m and standard deviation of 10 cm. How many percentage of waste bins manufactured were a) More than 130 cm b) Less than 115 cm c) From 122 cm to 128 cm d) Between 118 cm and 132 cm e) At least 120 cmModified True or False VIFs exceeding 10 are sign of low autocorrelation.